ORIGINAL ARTICLE
2D numerical model of downward push pull ventilation for protecting workers against airborne infection
Modelo numérico 2D de ventilación push pull descendente para proteger a los trabajadores contra las infecciones transmitidas por el aire
Ratna
Sari Dewi1 ![]() *,
Burniadi Moballa2
*,
Burniadi Moballa2 ![]() *,
Anny Maryani1
*,
Anny Maryani1 ![]() *,
Ni’matut Tamimah2
*,
Ni’matut Tamimah2 ![]() *,
Dimas Hafidz Bramansyah2
*,
Dimas Hafidz Bramansyah2 ![]() *,
Muhammad Wahyudin1
*,
Muhammad Wahyudin1 ![]() *
*
1Institut Teknologi Sepuluh Nopember. Surabaya, Indonesia.
2Politeknik Perkapalan Negeri Surabaya. Surabaya, Indonesia.
Cite as: Dewi RS, Moballa B, Maryani A, Tamimah N, Bramansyah DH, Wahyudin M. 2D numerical model of downward push pull ventilation for protecting workers against airborne infection. Salud Cienc. Tecnol. 2022;2(S2):151. https://doi.org/10.56294/saludcyt2022151
Submitted: 07-11-2022 Revised: 10-12-2022 Accepted: 19-12-2022 Published: 31-12-2022
Editor:
Fasi Ahamad Shaik ![]()
ABSTRACT
Industrial clusters contributed significantly to the spread of Covid-19 worldwide, including in Indonesia. One of the causes is that maintaining a minimum distance of 1 to 2 meters between workers is often challenging due to the plant layout and work system design limitations. Therefore, an intervention to the workstation is needed to protect industrial workers from potential exposure to Covid-19 and other airborne infections. One technology that has a high potential to be applied to solve this problem is the air curtain/personalized ventilation. This research analyzes the effectiveness of downward push-pull air curtain in protecting workers from inhaling the infected microdroplet. The extent to which the downward push-pull ventilation can withstand the burst of microdroplets was studied by varying the air speed ratios of the air curtain. A 2D simulation was carried out with Salome, OpenFOAM, and ParaView softwares. Two scenarios were tested, i.e., the distance between the person who is coughing is 0,5 and 1 meter from the air curtain. For the distance of 0,5 meter, the results showed that the optimum velocity ratio between the pushed and pulled air was 0,17 with a droplet penetration percentage of 8,98 %. While for 1 m, the optimum velocity ratio was 0,25 with a droplet penetration percentage of 5,67 %.
Keywords: Covid-19; Droplets; Push-pull Ventilation; Speed Ratio.
RESUMEN
Los conglomerados industriales han contribuido significativamente a la propagación de Covid-19 en todo el mundo, incluida Indonesia. Una de las causas es que mantener una distancia mínima de 1 a 2 metros entre los trabajadores es a menudo un reto debido a la disposición de la planta y a las limitaciones del diseño del sistema de trabajo. Por lo tanto, es necesario intervenir en el puesto de trabajo para proteger a los trabajadores industriales de la posible exposición a Covid-19 y otras infecciones transmitidas por el aire. Una tecnología que tiene un alto potencial de aplicación para resolver este problema es la cortina de aire/ventilación personalizada. Esta investigación analiza la eficacia de la cortina de aire push-pull descendente para proteger a los trabajadores de la inhalación de microgotas infectadas. Se estudia hasta qué punto la ventilación push-pull descendente puede resistir la irrupción de microgotas variando las relaciones de velocidad del aire de la cortina de aire. Se realizó una simulación 2D con los programas Salome, OpenFOAM y ParaView. Se probaron dos escenarios, es decir, la distancia entre la persona que tose es de 0,5 y 1 metro de la cortina de aire. Para la distancia de 0,5 metros, los resultados mostraron que la relación de velocidad óptima entre el aire empujado y el aire arrastrado era de 0,17, con un porcentaje de penetración de las gotas del 8,98 %. Mientras que para 1 m, la relación de velocidad óptima fue de 0,25 con un porcentaje de penetración de gotas del 5,67 %.
Palabras clave: Covid-19; Gotas; Ventilación Push-pull; Relación de Velocidades.
INTRODUCCIÓN
According to data from the World Health Organization (WHO), more than 210 countries worldwide have been affected by the Covid-19 outbreak. The industrial cluster in Indonesia is one of the areas with the highest spread of COVID-19 infections. This is supported by data from the “Satgas Percepatan Penanganan Covid-19 Surabaya” (“Surabaya Covid-19 Handling Acceleration Task Force”) on March 7, 2021, which mentioned that several industrial clusters dominated the spread of Covid-19 in Surabaya. Thirty-six percent of Covid-19 cases have been linked to workplace transmission. According to data from the Indonesian Industry Ministry, 2 % of Covid-19 cases were experienced by factory workers. For example, there were cases of Covid-19 at the Sampoerna Surabaya, a cigarette factory, where a total of 77 workers were exposed to Covid-19.
Physical distancing is a commonly recommended effort to prevent the spread of Covid-19. WHO recommends maintaining a distance of at least 1 meter from other people. However, keeping a safe distance between workers in the industry is not always easy. The limited work area causes workers to be close to each other while working.(1)
It is known that Covid-19 is transmitted through droplets that come out with breathing, coughing, sneezing, or other exhalations and then spread in the nearby air. There has been much discussion about the transmission process. For instance, there have been indirect transmission cases, which have become the subject of a debate over the airborne transmission of Covid-19 via micro-droplets.(2) Regardless of these facts, the WHO has not issued a guide for air conditioning systems to avoid the transmission of Covid-19, especially in industry.
Various studies show a close relationship between the spread of disease through indoor air (airborne infection) with ventilation systems or air conditioning, transmission between workers in industrial environments, and cross-transmission between patients in health care environments.(3) One method to control infections spreading through the air is to regulate the air conditioning in the room. However, there has been no definitive study on the air conditioning system specifications that can meet the infection control needs. A study recommends dissolving exhaled air from infected patients 10,000 times with clean air to reduce the infection risk.(4) However, this technique will cause the ventilation cost to significantly increase due to the sizable volumetric flow rate of the air used.(5)
Another recommended alternative method is personalized ventilation (PV), in which clean air is blown out into the respiratory area of the patient or worker.(5,6,7) However, several aspects of PV performance relevant to airborne disease transmission patterns have yet to be confirmed.(8) First, the ability of PV to influence the spread of relatively large (>5 m) droplets, which are the primary carriers of airborne viral infections such as Covid-19, is not yet known. Second, since the design of the PV requires air to blow in both pushed and pulled mechanisms, it is likely that pathogens will mix with the clean air and eventually be inhaled by the workers.
Therefore, this research analyzes environmental management methods with a push-pull air curtain system (Fig. 1) where push-pull ventilation can protect workers from inhaling infectious microdroplets or harmful vapors. Mainly, this study focuses on downward push-pull ventilation. As a result, this study aims to study the effectiveness of implementing downward push-pull ventilation in the workplace to reduce the risk of spreading Covid-19 among workers in the same room. Two scenarios were tested, in which the distance between the coughing person and the PV air curtain was 0,5 and 1 meter. Specifically, we sought to analyze the optimum velocity ratio to minimize droplet penetration. The Computational Fluid Dynamics (CFD) method in 2D is used to analyze the push-pull airflow and velocity.
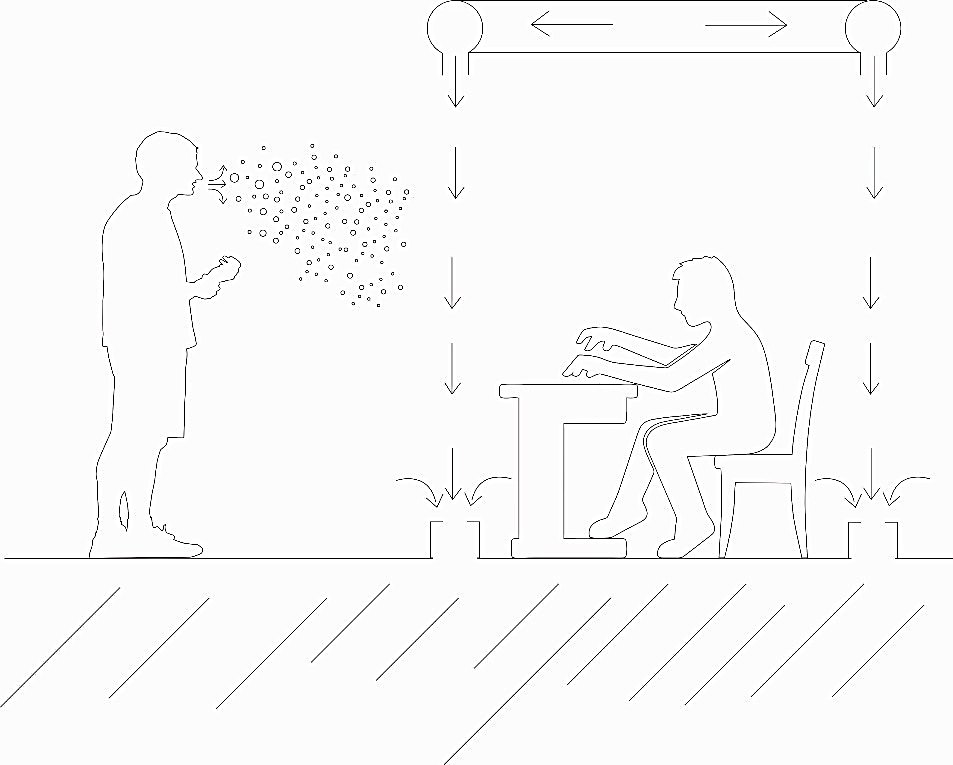
Figure 1. Downward push-pull air curtain
METHODS
2.1 Apparatus
This study employed the open source SALOME platform as a preprocessor for geometry modelling, cfMesh as the grid generator, the open source CFD package OpenFOAM as the solver, and ParaView for post-processing. The cases were run on a 32 core AMD Ryzen Treadripper 3970X.
2.2 Research Stages
Figure 2 shows the flowchart of our research, explaining the stages in the numerical study for evaluating the effectiveness of downward push-pull ventilation to protect factory workers from Covid-19 transmission.

Figure 2. Flow chart of the research method
2.2.1 Data Collection
The flow rate of air during coughing or sneezing coming out of workers is determined according to the formula recommended by Gupta et al.(9).The number of droplets exhaled during the coughing process is determined according to the test results obtained by Xie et al.(10). An adjustable anthropometric human model of a typical Asian was obtained commercially from 3Dhumanmodel.com. The pose of the model was adjusted according to the scenarios of the present study.
2.2.2 Geometry Modelling and Meshing
The dimensions of simulation domains are determined according to the human model. By referring to the dimensions, a 2D model was constructed using SALOME (Fig. 3). In the presented scenarios, the cough emitter is the outside worker, which is positioned on the left-hand side in the 2D model (Fig. 3b-c).
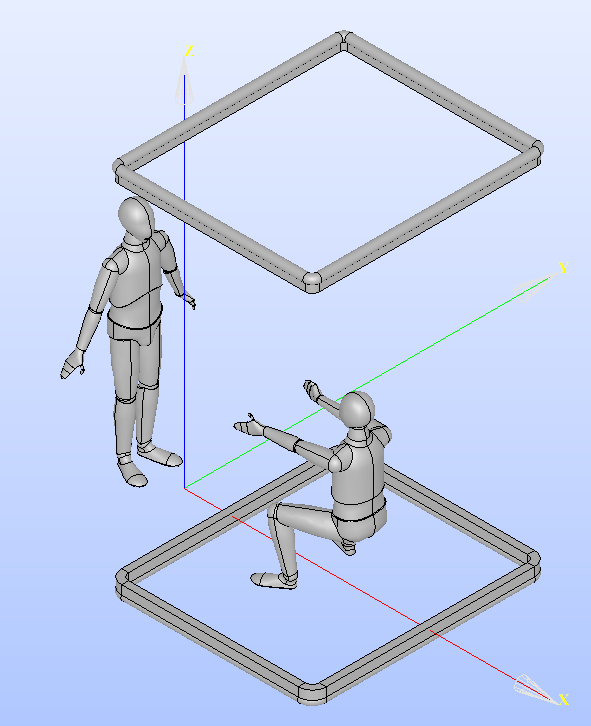
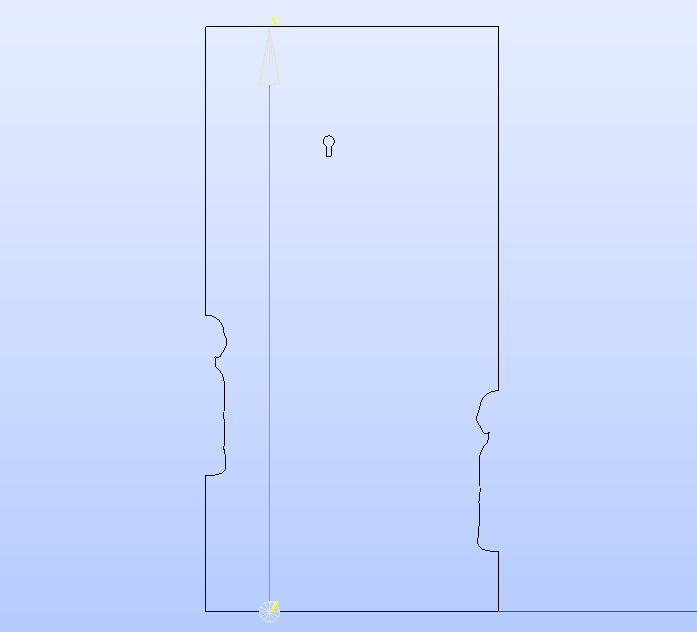
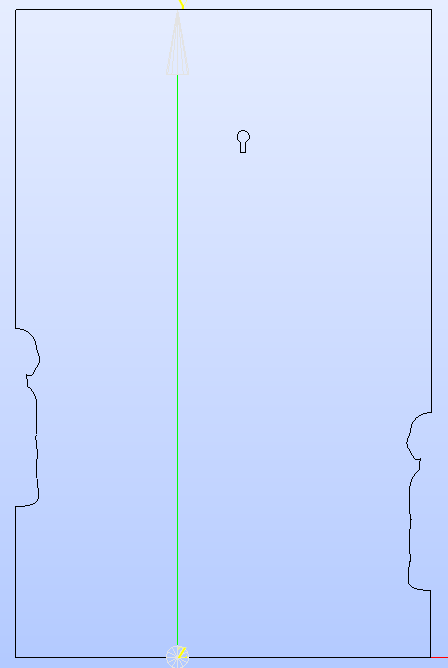
Figure 3. Simulation scenarios and domains: (a) 3D depiction of the simulation scenario; (b) 2D domain with coughing worker standing 0,5 m from the air curtain; (c) 2D domain with coughing worker standing 1,0 m from the air curtain.
The meshing process discretizes the 2D domain into smaller, connected parts. An adaptive Cartesian mesh, which size was determined using a grid independence study, was used. A smaller mesh size was employed around the human body, around the cough and push-pull jets as shown in Fig. 4. The meshing process is conducted by employing the Cartesian2DMesh function from cfMesh.
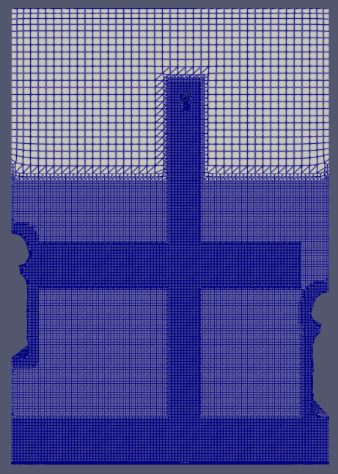
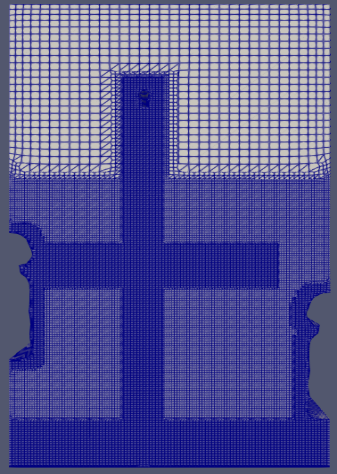
(a) (b)
Figure 4. Adaptive meshing of the 2D domains: (a) Coughing worker standing 0,5 m from the air curtain; (b) Coughing worker standing 1,0 m from the air curtain.
2.2.4 Numerical Model
The present study deals with highly turbulent flows coming out of a human mouth opening, which demands a suitable turbulent model. The transient nature of the cough exhalation rules out the use of the Reynolds averaged Navier-Stokes equation (RANS) model. Therefore, the present study used the Large Eddy Simulation (LES) model.
RESULTS AND DISCUSSIONS
The Design of Workstation with Downward Push Pull Ventilation and Coughing Speed Data
Cough flow rate over time was calculated using the formula proposed by Gupta et al.(9), based on a male human with a height of 1.68 m and a weight of 68 kg. Cough velocity over time was estimated using a mouth opening of A = 0,000336 m2 applying the well-known formula denoted in equation 1.
Time history of cough velocity is depicted in Fig. 5.
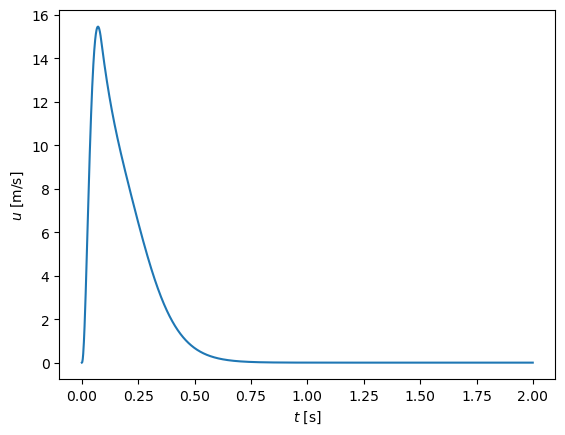
Figure 5. Cough air velocity over time for a typical Asian male
Grid independence
A grid independence study was conducted to determine appropriate mesh size by simulation cough exhalation from the same human model but without any curtain or obstacle downstream. Three different maximum mesh sizes (0,17 mm, 0,2 mm, and 0,22 mm) were studied. The traveling distance of the droplets clouds between those three different mesh sizes was compared. The comparison is depicted in Fig. 6. From the figures, we can conclude that a maximum mesh size of 0,2 m is sufficient for the subsequent parameter study.

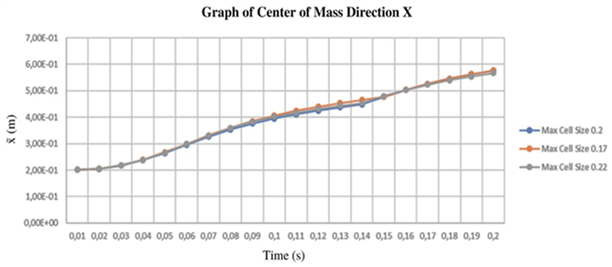

Figure 6. Position of the center of mass of the droplets cloud over time in x, y, z direction
Parameter Study
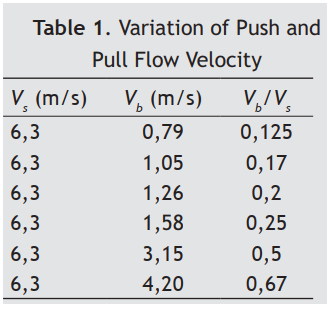
The push and pull velocities, respectively denoted as Vb and Vs, are determined according to the formula proposed by Huang et al.(11) for the strong suction flow regime. However, it should be noted that in the present configuration, push and pull nozzles are positioned vertically, where the push-air flows downward, while in Huang et al., the nozzles are positioned horizontally. Considering the difference in flow configuration between our study and Huang’s study,(11) the formula only provides a first estimate. A further exploration of parameters was required to obtain the flow regime of the present configuration.
Based on the designated distance of the push nozzle from the floor (2,5 m), which is determined according to ergonomic consideration, Huang et al.(11) formula produces suction/pull velocity of 6.3 m/s. This pull velocity is held constant while the push velocity is varied between 0,79-4,2 m/s which corresponds to a push-pull ratio of 0,125-0,67. A detailed list of parameter variation can be seen in Table 1. The total number of droplets exhaled during a coughing even for the given anthropomorphic model is 423.
A common flow pattern found in the result of the numerical experiment can be seen in Fig. 7a-d. At t = 0,1 s, we observe that the pull jet expanded and formed a vortex pair just above the head of the outside worker due to the entrainment process with the ambient air. The cough jet exhaled by the worker outside of the curtain begins to be entrained by the wake of the pull jet from the upper pull nozzle. At t = 0,5 s, cough jet from the worker outside of the curtain has stopped. The droplets cloud formed from the exhalation jet is entrained with the vortex pair from the push jet. The remaining figures (Fig. 7c-d) shows that the vortex pair was convected downward to the pull nozzle. However, the pull flow also creates vortices around the body of the inside worker, which induces dispersion of the droplets. Due to this dispersion, some droplets penetrate the working space inside the air curtain.
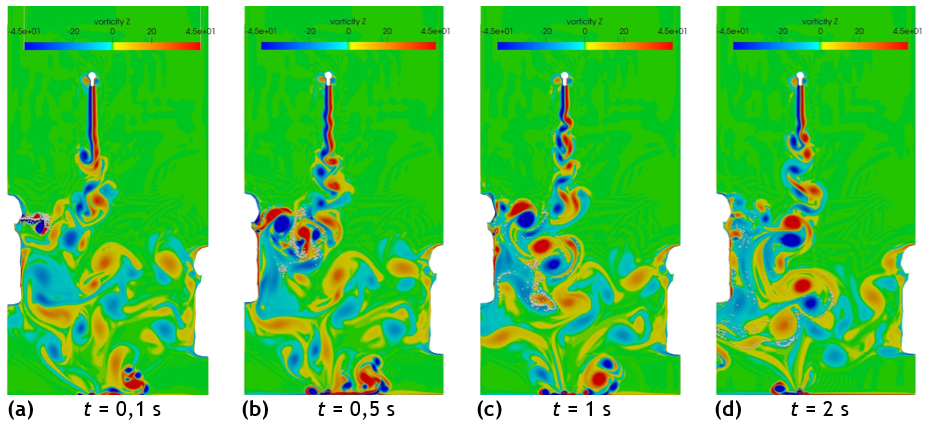
Figure 7. Vorticity field of Vb/Vs = 0,2 and cough source at 0,5 m from the air curtain for t = 0,1-2 s after the start of cough exhalation
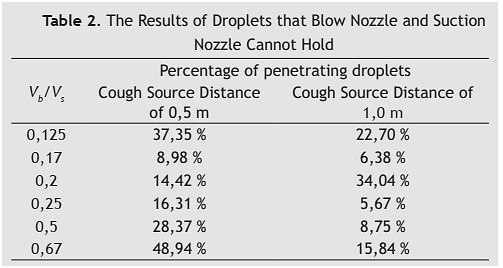
Percentage of droplets which are convected into the working space inside the curtain is depicted in Table 2. Generally, the percentage decreases when the distance of the cough source from the curtain is increased. We can see from the table that the present push-pull velocity configuration cannot completely prevent the dispersion of droplets into the working space. The percentage of droplets inside the working space decreases when the velocity ratio is increased from 0,125 to 0,17. However, when the velocity ratio is further increased, the percentage increases again, which suggests that at higher velocity ratios, the pull flow is not enough to contain the pull jet. This is an indication that the flow regime at higher velocity ratios is the over blow regime. We can also see from the table that the velocity ratio of 0,17 gives a consistently low percentage (< 10 %) for both cough source distances.
This fact suggests that the flow regime transition of the vertical downward push-pull air curtain with a larger gap between push and pull nozzles is different compared to previous studies.(11, 12) Previous tests investigated the flow regimes of the push-pull air curtain under a rather steady state upward naturally convective flow of air, which has a considerably lower velocity compared to the pull or push velocity either in a perpendicular or parallel direction to the air curtain. Meanwhile, the cough jet in the present study is a transient flow with a considerably higher peak velocity compared to the push and pull velocities that induce stronger entrainment. This may also contribute to the change in flow regime.
CONCLUSIONS AND FUTURE WORKS
The present push and pull velocities, which produced a strong suction regime in previous studies, exhibit dispersion or over blow regime. Therefore, cough droplets are still convected inside the working space and contacted the body of the inside worker. Push-pull velocity ratio 0,17 was found to minimize the number of penetrating droplets for both cough source distance from the curtain.
Further parameter variations are required to fully map the flow regime under the current configuration.
REFERENCES
1. Saidan MN, Shbool MA, Arabeyyat OS, Al-Shihabi ST, Abdallat YA, Barghash MA, Saidan H. Estimation of the probable outbreak size of novel coronavirus (COVID-19) in social gathering events and industrial activities. Int J Infect Dis. 2020;98:321-7. doi: 10.1016/j.ijid.2020.06.105.
2. Lu J, Gu J, Gu J, Li K, Xu C, Su W, Lai Z, Zhou D, Yu C, Xu B, Yang Z. COVID-19 outbreak associated with air conditioning in a restaurant in Guangzhou, China, 2020. Emerg Infect Dis. 2020;26(7):1628-31. doi: 10.3201/eid2607.200764.
3. Li Y, Leung GM, Tang JW, et al. Role of ventilation in airborne transmission of infectious agents in the built environment: a multidisciplinary systematic review. Indoor Air. 2007;17:2-18. doi: 10.1111/j.1600-0668.2006.00445.x.
4. Jiang Y, Zhao B, Li X, et al. Investigating a safe ventilation rate for the prevention of indoor SARS transmission: an attempt based on a simulation approach. Build Simul. 2009;2:218-89. doi: 10.1007/s12273-009-9325-7.
5. Nielsen PV. Control of airborne infectious diseases in ventilated spaces. J R Soc Interface. 2009;6:218-89. doi: 10.1098/rsif.2009.0228.focus.
6. Cermak R, Melikov AK. Protection of occupants from exhaled infectious agents and floor material emissions in rooms with personalized and underfloor ventilation. HVAC R Res. 2007;13:23-38. doi: 10.1080/10789669.2007.10390942.
7. Bolashikov ZD, Melikov AK. Methods for air cleaning and protection of building occupants from airborne pathogens. Build Environ. 2009;44:1378-85. doi: 10.1016/j.buildenv.2008.09.001.
8. Xu C, Liu L. Personalized ventilation: one possible solution for airborne infection control in highly occupied spaces. Indoor Build Environ. 2018;27:873-6. doi: 10.1177/1420326X18777383.
9. Gupta JK, Lin CH, Chen Q. Flow dynamics and characterization of a cough. Indoor Air. 2009;19(6):517-25. doi: 10.1111/j.1600-0668.2009.00619.x.
10. Xie X, Li Y, Sun H, Liu L. Exhaled droplets due to talking and coughing. J R Soc Interface. 2009;6. doi: 10.1098/rsif.2009.0388.focus.
11. Huang RF, Lin SY, Jan SY, et al. Aerodynamic characteristics and design guidelines of push-pull ventilation systems. Ann Occup Hyg. 2005;49:491-15. doi: 10.1080/15459620601155749.
12. Chern MJ, Ma CH. Numerical investigation and recommendations for push-pull ventilation systems. J Occup Environ Hyg. 2007;4:184-97.
Conflicts of interest
None
Financing
None
Authorship contribution
Conceptualization: Ratna Sari Dewi, Burniadi Moballa, Anny Maryani, Ni'matut Tamimah, Dimas Hafidz Bramansyah, Muhammad Wahyudin.
Methodology: Ratna Sari Dewi, Burniadi Moballa, Anny Maryani, Ni'matut Tamimah, Dimas Hafidz Bramansyah, Muhammad Wahyudin.
Writing - Original Draft: Ratna Sari Dewi, Burniadi Moballa, Anny Maryani, Ni'matut Tamimah, Dimas Hafidz Bramansyah, Muhammad Wahyudin.
Writing - Review & Editing: Ratna Sari Dewi, Burniadi Moballa, Anny Maryani, Ni'matut Tamimah, Dimas Hafidz Bramansyah, Muhammad Wahyudin.