ORIGINAL
Muscleness and fatness phenotypes for diabetes and hypertension prediction from the Chilean National Health Survey 2016-17
Fenotipos de Musculosidad y Adiposidad en la Predicción de Diabetes e Hipertensión desde la Encuesta Nacional de Salud de Chile 2016-17
Cristian Alvarez1 ![]() *,
Christian Campos-Jara1
*,
Christian Campos-Jara1 ![]() *,
Francisco Guede-Rojas1
*,
Francisco Guede-Rojas1
![]() *,
Claudia Marchant1
*,
Claudia Marchant1 ![]() *,
Héctor Márquez2
*,
Héctor Márquez2 ![]() *,
Lorena Martínez-Ulloa1
*,
Lorena Martínez-Ulloa1 ![]() *,
Igor Cigarroa3
*,
Igor Cigarroa3
![]() *,
Jaime Vásquez-Gómez4
*,
Jaime Vásquez-Gómez4 ![]() *,
Carmen Luz Muñoz-Mendoza5
*,
Carmen Luz Muñoz-Mendoza5
![]() *,
Cristian Caparros-Manosalva6,7
*,
Cristian Caparros-Manosalva6,7
![]() *,
Pedro Delgado-Floody8
*,
Pedro Delgado-Floody8
![]() *
*
1Exercise and Rehabilitation Sciences Institute, School of Speech Therapy, Faculty of Rehabilitation Sciences. Universidad Andres Bello. Santiago, 7591538, Chile.
2Carrera de Kinesiología. Universidad Andres Bello. Concepción, Chile.
3Escuela de Kinesiología, Facultad de Salud. Universidad Católica Silva Henríquez. Santiago, 8240000, Chile.
4Centro de Investigación de Estudios Avanzados del Maule (CIEAM). Universidad Católica del Maule. Talca, Chile.
5Departamento de Enfermería, Facultad de Ciencias de la Salud y de los Alimentos. Universidad del Bío-Bío. Chillán, Chile.
6Departamento de Ciencias del Movimiento Humano, Facultad de Ciencias de la Salud. Universidad de Talca. Talca, Chile.
7Interuniversity Center for Healthy Aging (CIES). RED21993, Chile.
8Department of Physical Education, Sports and Recreation. Universidad de La Frontera. Temuco, 4811230, Chile.
Cite as: Alvarez C, Campos-Jara C, Guede-Rojas F, Marchant-Mella C, Márquez H, Martínez-Ulloa L, Cigarroa I, Vásquez-Gómez J, Muñoz-Mendoza CL, Caparros-Manosalva C, Delgado-Floody P. Muscleness and fatness phenotypes for diabetes and hypertension prediction from the Chilean National Health Survey 2016-17. Salud, Ciencia y Tecnología. 2024; 3:814. https://doi.org/10.56294/saludcyt2024814
Submitted: 26-11-2023 Revised: 05-02-2024 Accepted: 13-04-2024 Published: 14-04-2024
Editor:
Dr. William Castillo-González ![]()
ABSTRACT
Introduction: diabetes and arterial hypertension are increasing in adults, where calf circumference and waist circumference are two clinical epidemiological markers poorly studied for predicting cardiometabolic risk.
Objective: to characterize four phenotypical models in the Chilean adult population based on muscleness and fatness using both calf circumference and waist circumference outcomes.
Methodology: An epidemiological observational cross-sectional representative study based on the Chilean National Health Survey 2016-17, where four phenotypes groups were analyzed; Low skeletal muscle mass and high-waist circumference (Lsmm-Hwc, n=140), low skeletal muscle mass and low waist circumference (Lsmm-Lwc, n=242), high skeletal muscle mass and high waist circumference (Hsmm-Hwc, n=1076), and high skeletal muscle mass and low waist circumference (Hsmm-Lwc, n=1358). These groups described information about diabetes, hypertension prevalence, including other risk factors.
Results: the reference group Hsmm-Lwc group showed lower fasting plasma glucose (FPG) vs. Hsmm-Hwc (90,4 [95%CI] [89,0; 91,8] vs. 111,7 [109,1; 114,3]), and vs. Lsmm-Hwc (90,4 [89,0; 91,8] vs. 118.,3 [107,2; 129,4] mg/dL, both P<0,0001). Lower levels (i.e., appropriate) of FPG (R2 4,8 %), glycated hemoglobin (R2 2,6 %), systolic BP (R2 19,0 %), and diastolic BP (R2 2,5 %) were significantly associated (all, P<0,0001) with the Reference group Hsmm-Lwc.
Conclusion: A high muscleness and low fatness phenotype is present in those who are younger adults, is associated with better glucose/blood pressure control, and reports low cardiovascular risk factors for diabetes and hypertension in Chilean adults.
Keywords: Body Composition; Sedentary Behavior; Diabetes Mellitus; Hypertension.
RESUMEN
Introducción: la diabetes y la hipertensión arterial están aumentando en adultos, donde la circunferencia de la pantorrilla y la circunferencia de la cintura son dos marcadores clínicos epidemiológicos poco estudiados para la predicción de riesgo cardiometabólico.
Objetivo: caracterizar cuatro modelos fenotípicos en la población adulta chilena basados en musculatura y adiposidad, utilizando tanto el perímetro de la pantorrilla y perímetro de la cintura.
Metodología: estudio epidemiológico, observacional, transversal y representativo, basado en la Encuesta Nacional de Salud de Chile 2016-17, donde se analizaron cuatro fenotipos; Baja masa muscular y elevada circunferencia de cintura (Lsmm-Hwc, n=140), baja masa muscular y baja circunferencia de cintura (Lsmm-Lwc, n=242), elevada masa muscular y elevada circunferencia de cintura (Hsmm-Hwc, n=1076) y elevada masa muscular y baja circunferencia de cintura (Hsmm-Lwc, n=1358). Estos grupos describieron información de prevalencia de diabetes, hipertensión y de otros factores de riesgo.
Resultados: el grupo de referencia Hsmm-Lwc mostró menores niveles de glicemia en ayunas (FPG) en comparación a los grupos Hsmm-Hwc (90,4 [IC 95%] [89,0; 91,8] vs. 111,7 [109,1; 114,3]) y vs. Al grupo Lsmm-Hwc (90,4 [89,0; 91,8] vs. 118,3 [107,2; 129,4] mg/dL, ambos P<0,0001). Los niveles más bajos (i.e., apropiados) de glicemia en ayunas (R2 4,8%), hemoglobina glicosilada (R2 2,6 %), presión sistólica (R2 19,0 %) y diastólica (R2 2,5 %) se asociaron significativamente (todos, P<0,0001) con el grupo de referencia Hsmm-Lwc.
Conclusión: un fenotipo de alta musculatura y baja adiposidad está presente en aquellos adultos más jóvenes, se asocia con un mejor control de la glicemia/presión arterial y reporta bajos factores de riesgo cardiovascular para diabetes e hipertensión en adultos chilenos.
Palabras claves: Composición corporal, Comportamiento sedentario, Diabetes mellitus, Hipertensión
INTRODUCTION
Physical activity (PA), nutrition, and sleep patterns among others (i.e., lifestyle) play a key role in modern societies in terms of maintenance of cardiometabolic health (i.e., that includes both cardiovascular and metabolic/endocrine systems) and avoiding diabetes and hypertension (HTN).(1) By contrast, physical inactivity (i.e., do not adhere to international PA guidelines of 150−300 min of low-to-moderate PA·week, or 75 to 150 of vigorous PA·week),(2) is associated with more diabetes and HTN prevalence in children/adolescents and adults.(3,4)
Before diabetes and HTN diagnosed, the adult population transit through previous and prevented health symptoms such as skeletal muscle mass decline (SMM, i.e., sarcopenia) and higher adiposity accumulation, as for example, calf circumference decreases(4) and waist circumference increases (WC) to each outcome respectively.(6) Thus, it is well known that a phenotypical model of low SMM decreases glucose control, promotes adiposity accumulation,(7) and subsequently increases diabetes risk by intramyocellular fatty acids accumulation.(8) By contrast, healthy adults who are physically active and adhere to a healthy lifestyle, report better SMM levels.(9) The SMM under insulin-stimulated conditions, account for more than 80 % of glucose disposal,(7) being important for young and adults the adherence to international PA guidelines with the aims of preventing diabetes and HTN risk factors.(10,11)
One of the common phenotypes in physically inactive populations, is the lower SMM in association with higher adiposity (i.e., fatness), or appropriate/higher SMM (i.e., muscleness) but in association with higher adiposity.(12) For example, previous studies of phenotypes, have shown that higher cardiorespiratory fitness (CRF, reported by the maximum oxygen consumption, VO2max) in combination with reduced body fat were associated with lower risk factors for HTN, metabolic syndrome, and dyslipidemia in adults.(12)
It has also been corroborated similar phenotypes, where children/adolescents (age 12,2±2,7 years old, n=3,866) with higher CRF showed characteristics of better blood pressure control than peers with lower CRF.(13) More recently, the sarcopenic-obesity phenotypical model based on the handgrip strength (HGS) together with the body mass index plus waist circumference reported that there is a pre-sarcopenic-obesity prevalence of 22,6 % in Chilean adults, based on the Chilean National Health Survey 2016-17 (NHS16-17).(14)
However, there is little knowledge about the association of a ‘muscleness’ or’ fatness’ human phenotype model by using SMM by calf circumference (CC), and waist circumference (WC) as adiposity markers based on Chilean NHS16-17 information. CC have been previously used as an early indicator of SMM loss in adults.(15,16) In Latin-American older adults, previous studies of CC have demonstrated sensitivity (71,5 %), and specificity (77,4 %) to detect SMM declining.(5) Other reports show that CC is also correlated with Dual X-ray absorptiometry,(17) and with the loss of autonomy.(18)
This study aimed to characterize four phenotypical models in the Chilean Latin-American population based on muscleness and fatness using both CC and WC outcomes from the NHS16-17. There was hypothesized that phenotypes with higher SMM and lower WC show a better glucose and blood pressure control. The importance of this research consists in the possibility to propose the incorporation of future more robust equipment for body composition analyses into epidemiological cross-sectional studies as the NHS16-17 for an early prevention of these diseases.
METHODS
Research type
The following is a cross-sectional study based on the Chilean NHS16-17 of Chile, which is a prevalence, multi-stage and representative study applied in at home with families using random, stratified-by-conglomerates methods.
Population
The data of the NHS16-17 of Chile includes a personal home-based visit to population ≥15 y old, with or without an ethnic origin, from urban/ rural areas of this country. Considering the total NHS16-17 sample reported by the NHS16-17 of (n=6,233) participants, the present study included (n=2j836) subjects who report the information of interest to the hypothesis test. The NHS16-17 included data of population of ≥15 years old, and all full criteria of inclusion can be found at the Epidemiological Unit of the Chilean Health Ministry (MINSAL) at http://epi.minsal.cl/encuesta-ens-descargable/ To this descriptive study, we used the selected data that included the SMM and WC information including diabetes, HTN and other relevant outcomes reported as risk factors. The study protocol was approved by the Ethical Committee of the Escuela de Medicina de la Pontificia Universidad Católica de Chile (16-019), and all participants signed an informed consent.(18)
Muscleness and fatness phenotypes
Based on CC for muscleness and waist circumference (WC) for fatness, four different phenotypes models were analyzed based on the NHS16-17 data, as follows; Low-skeletal muscle mass and high-waist circumference (Lsmm-Hwc), Low-skeletal muscle mass and low-waist circumference (Lsmm-Lwc), High-skeletal muscle mass and high-waist circumference (Hsmm-Hwc), and High-skeletal muscle mass and low-waist circumference (Hsmm-Lwc). The cut-off point of 34 cm of CC has previously demonstrated sensitivity (71,5 %) and specificity (77,4 %) for assessing SMM in Latin-American (i.e., Brazilian) older adults men, and cut-off points of 33 cm for women has also demonstrated similar sensitivity (80,0 %) and specificity (84,6 %).(5) On the other hand, WC was categorized as higher WC (men ≥90 cm, women ≥80 cm), or low WC (men <89 cm, women <79 cm).(18)
Diabetes and arterial hypertension markers (Main outcomes)
To glucose control, both fasting plasma glucose (FPG) and glycated hemoglobin (HbA1c) were measured. Both outcomes were measured with 8 h of fasting state and were measured similarly as reported in previous studies.(19)
For blood pressure control, both systolic (SBP) and diastolic (DBP) were measured in the left arm three times and the average of these was registered. To the present study, there was used the current blood pressure categorization of the American Heart Association 2018; ‘Normal BP’ was defined as SBP/DBP less than 120/80 mmHg, ‘elevated BP’ (Ele) as SBP/DBP between 120-129/80 mmHg, ‘stage 1 HTN’ as SBP/DBP between 130-139/80-89 mmHg, and ‘stage 2 HTN’ as SBP/DBP greater than or equal to 140/90 mmHg.(20) The readings were taken using an automatic monitor (OMRONTM, model HEM 7114) similar to previously.(4) This test was developed by professional nursing at-home conditions.
Anthropometric measurements (Secondary outcomes)
The weight was measured by a digital electronic scale OMRONTM, model HBF-514C (OMRON Corporation, Kioto, Japon), (sensitivity of 100 g, maximum weight capacity ~150 kg), where height and waist circumference were measured by an inextensible tape. similar as previous studies.(21) The nutritional state was classified by the BMI using weight plus height, as follows; Underweight, Normal-weight, overweight, obesity I, obesity II, obesity III, and morbid obesity, and reported as (n = ) and percentage ( %) by each phenotypical model, following the WHO criteria.(22)
Metabolic risk factors (Secondary outcomes)
As additional outcomes, there was included lipid profile markers; total cholesterol (Tc), low-density lipid cholesterol (LDL-c), high-density lipid cholesterol (HDL-c), plasma triglycerides (Tg), very-low-density lipids (VLDL-c) following NCEP ATP-III criteria.(23) We also reported the sleep time (during the week, in (h·day), that were categorized as low (<6 h), moderate (7 to 9 h), and high sleep time (≥9 h), following previous studies from the NHS16-17.(24)
Physical activity measurement (Secondary outcome)
There was reported the amount (min·day) of PA of vigorous, moderate, and low-intensity using the Global Physical Activity Questionnaire (GPAQv2).(25) All measurements mentioned were applied following the application manual F2 of the NHS16-17.
Cardiovascular risk estimation (Secondary outcome)
The cardiovascular risk was categorized by scale punctuation in low (0-4 points), moderate (5 to 9 points) and high cardiovascular risk (≥10 points) using the metabolic syndrome outcomes (blood pressure, FPG, HDL-c, and Tg), including tobacco habit, alcohol consumption, dyslipidemia, sleep patterns, as well by the three questions included as follows; a) in the self-report on acute myocardial infarction ¿Has a doctor or physician ever told you had or suffered a heart attack? Being the prevalence from those who answered “Yes”; b) the question for the self-reported prevalence of stroke “Has a doctor or physician ever told you had or suffered a stroke? Or had or suffered a stroke or cerebral thrombosis (or stroke)?”, and c) the question about the self-reported prevalence of peripheral venous disease “Has a doctor or physician ever told you had or suffered from peripheral vascular disease or to the arteries in your legs?”.(26)
Statistical analyses
Data for continuous outcomes are shown as mean and (95 %CI), and for categorical outcomes as frequency (n = ) and ( %, percentage). The normality was tested using the Shapiro-Wilk test and using histograms and Q-Q plots. For continuous outcomes, the interaction of each main and secondary outcome among the four phenotypes (Lsmm-Hwc, Lsmm-Lwc, Hsmm-Hwc, and Hsmm-Lwc) was tested using analysis of covariance (ANCOVA) (groups, sex, and age) as covariables. The chi-square test was used to compare categorical outcomes. Bonferroni adjustments were used to confirm the differences across a phenotype group. Linear regression analyses were applied to test the association between diabetes and hypertension markers with the four muscleness and fatness phenotype models. The coefficient of determination R2 in percentage (for predicting independent outcome), and r= Pearson correlation test was reported. To detect multicollinearity, there was used the diagnosed condition indices (CNI). Collinearity was determined if the largest CNI exceeded the 30 values. There was also tested sensitivity/specificity to FPG (77,7 % / 72,5 %), HbA1c (80,8 % / 76,5 %), SBP (58,5 % / 57,4 %), DBP (59,9 % / 53 %) using ROC analysis (data not shown). All statistical tests were carried out using the SPSSTM software 24 version for Windows (IBM SPSS Inc., Chicago, IL, USA).
RESULTS
Continuous (age, height, body mass, BMI, WC, CC, PAVI, PAMI, PALI, HGS) and categorical outcomes (nutritional state by BMI, diabetes, arterial hypertension prevalence, and sleep patterns) showed significant interaction by the four groups of phenotypes (Table 1).
The was a significant interaction in FPG by groups, where the Ref. group showed lower FPG vs. Hsmm-Hwc (90,4 [89,0; 91,8] vs. 111,7 [109,1; 114,3], P<0,0001), and vs. Lsmm-Hwc (90,4 [89,0; 91,8] vs. 118,3 [107,2; 129,4] mg/dL, P<0,0001) (Figure 1A). HbA1c showed a significant interaction by groups and age, being different between Ref. group vs. Lsmm-Lwc (6,1 [5,8; 6,2] vs. 6,7 [6,1; 7,1] %, P=0,034), and Lsmm-Hwc (6,1 [5,8; 6,2] vs. 7,1 [6,5; 7,6] %, P<0,0001) (Figure 1B). SBP showed significant interaction by groups, sex, and age, being SBP of Ref. different vs. Hsmm-Hwc (117 [115; 117] vs. 144 [142; 145] mmHg, P<0,0001), and vs. Lsmm-Hwc (117 [115; 117] vs. 146 [141; 151] mmHg, P<0,0001) (Figure 1C). There was a significant DBP interaction by groups, sex, and age, being different DBP Ref. vs. Hsmm-Hwc (70 [69; 71] vs. 77 [77; 80] mmHg, P<0,0001), and vs. Lsmm-Hwc (70 [69; 71] vs. 75 [73; 76], mmHg, P<0,0001) (Figure 1D).
There was a significant interaction by group, sex, and age in Tc, being different Tc Ref. vs. Lsmm-Hwc (177,1 [175; 179] vs. 194,2 [185; 204] mg/dL, P<0,0001) (Figure 2A). LDL-c interacts significantly by groups and age, and LDL-c Ref. was different vs. Lsmm-Hwc (101,6 [102,9; 118,6] vs. 110,8 [102,9; 118,6] mg/dL, P=0,044) (Figure 2B). HDL-c interacted significantly differently by group, sex, and age, and HDL-c Ref. was different vs. Hsmm-Hwc (52,9 [52,0; 53,7] vs. 46,8 [45,8; 47,7] mg/dL, P<0,0001) (Figure 2C). Tg showed a significant interaction by groups and age, where Ref. group was different vs. Hsmm-Hwc (113,4 [109,4; 117,3] vs. 152,8 [146,9; 158,6] mg/dL, P<0,0001), vs. Lsmm-Lwc (113,4 [109,4; 117,3] vs. 131,7 [119,4; 143,2] mg/dL, P=0,010) and vs. Lsmm-Hwc (113,4 [109,4; 117,3] vs. 163,4 [146,0; 180,6] mg/dL, P=0,044) (Figure 2D). VLDL-c showed a significant interaction by groups and age, where Ref. group was different vs. Hsmm-Hwc (22,4 [21,6; 23,1] vs. 30,2 [29,1; 31,3] mg/dL, P<0,0001), and vs. Lsmm-Hwc group (22,4 [21,6; 23,1] vs. 32,1 [28,8; 35,4] mg/dL, P<0,0001) (Figure 2E). There were significant differences in the prevalence of low, moderate, and high cardiovascular risk among the four models, where the Ref. Hsmm-Lwc model showed the main prevalence of subjects categorized with low cardiovascular risk vs. Hsmm-Hwc (33,5 vs. 5,0 %), vs. Lsmm-Lwc (33,5 vs. 3,1 %), and vs. Lsmm-Hwc (33,5 vs. 0,6 %) (Figure 2F).
|
Table 1. Characteristics of the Chilean population by each muscleness and fatness model based on the Chilean National Health Survey 2016-17 |
|||||
|
Outcomes |
Lsmm−Hwca |
Lsmm−Lwcb |
Hsmm−Hwcc |
(Ref.) Hsmm−Lwc |
p-Interaction by Groups |
|
Men; Women (n = ; n =) |
22;118 |
34; 208 |
463; 613 |
96; 1262 |
|
|
Total (n = ) |
140 |
242 |
1076 |
1358 |
|
|
Urban (n = / %) |
120 (85,7) |
199 (82,2) |
853 (79,3) |
1171 (86,2) |
0,0001# |
|
Rural (n = / %) |
20 (14,3) |
43 (17,8) |
223 (20,7) |
187 (13,8) |
|
|
Age (years) |
72,47 (71,0; 73,9)† |
74,06 (72,9; 75,2)† |
69,93 (69,5; 70,4)† |
42,14 (41,1; 43,1) |
0,0001 |
|
Height (cm) |
152,42 (150,9; 153,9)† |
151,05 (150,0; 152,0)† |
157,57 (156,9; 158,1) |
156,07 (156,1; 156,8) |
0,0001 |
|
Body mass (kg) |
66,07 (64,2; 67,8)†c |
53,29 (52,3; 54,2)†a |
77,96 (77,2; 78,7)†ab |
61,13 (60,6; 61,5) |
0,0001 |
|
Body mass index (kg/m2) |
28,47 (27,8; 29,1)†b |
23,43 (23,0; 23,8)†a |
31,57 (31,2; 31,8)†b |
25,02 (24,8; 25,2) |
0,0001 |
|
Nutritional state by BMI |
|
|
|
|
|
|
Underweight (n = / %) |
0 (0) |
18 (7,50) |
0 (0) |
27 (2,05) |
0,0001# |
|
Normal-weight (n = / %) |
17 (12,21) |
145 (60,26) |
46 (4,31) |
648 (47,74) |
|
|
Overweight (n = / %) |
84 (60,45) |
76 (31,53) |
392 (36,60) |
605 (44,61) |
|
|
Obesity I (n = / %) |
32 (23,01) |
2 (0,8) |
425 (39,70) |
75 (5,56) |
|
|
Obesity II (n = / %) |
5 (3,61) |
0 (0) |
144 (13,41) |
2 (0,11) |
|
|
Obesity III (n = / %) |
1 (0,72) |
0 (0) |
64 (6,07) |
1 (0,14) |
|
|
Waist circumference (cm) |
98,12 (96,81; 99,43)†b |
79,52 (78,55; 80,68)a |
103,62 (103,57; 104,29)†b |
80,37 (79,90; 80,71) |
0,0001 |
|
Leg circumference (cm) |
30,22 (29,84; 30,72)†c |
29,59 (29,22; 29,95)†c |
37,33 (37,15; 37,51)ab |
34,88 (34,43; 35,35) |
0,0001 |
|
‡Diabetes |
|
|
|
|
|
|
Yes (n = / %) |
6 (30,0) |
3 (11,1) |
137 (31,2) |
12 (13,0) |
0,0001# |
|
No (n = / %) |
14 (70,0) |
24 (88,9) |
302 (68,8) |
80 (87,0) |
|
|
&Hypertension |
|
|
|
|
|
|
Yes (n = / %) |
20 (90,9) |
21 (61,8) |
326 (70,6) |
58 (60,4) |
0,0001# |
|
No (n = / %) |
2 (9,1) |
13 (38,2) |
136 (29,4) |
38 (39,6) |
|
|
Lifestyle |
|
|
|
|
|
|
PAVI (min·day) |
8,0 (8,1; 24,1) |
1,2 (1,7; 4,2)†ac |
6,4 (4,0; 8,8)b |
5,5 (3,5; 7,5) |
0,627 |
|
PAMI (min·day) |
4,4 (0,3; 8,4) |
5,0 (2,4; 7,6) |
5,7 (4,5; 7,0) |
3,9 (2,8; 4,9) |
0,147 |
|
PALI (min·day) |
14,3 (11,0; 17,6) |
12,8 (10,6; 15,0) |
13,3 (12,3; 14,4) |
13,4 (12,5; 14,4) |
0,889 |
|
Handgrip stength (kg) |
39,13 (23,77; 54,50)†bc |
45,76 (36,26; 55,33)a |
60,69 (54,91; 66,41)*ab |
42,59 (33,75; 51,38) |
0,002 |
|
Sleep patterns |
|
|
|
|
|
|
<6 h (n = / %) |
42 (30,0) |
60 (24,8) |
369 (34,3) |
441 (32,5) |
0,0001# |
|
7 to 9 h (n = / %) |
66 (47,1) |
123 (50,8) |
556 (51,7) |
736 (54,2) |
|
|
≥9 h (n = / %) |
32 (22,9) |
59 (24,4) |
151 (14,0) |
181 (13,3) |
|
|
Data are shown as mean and (95 %CI) for continuous outcomes, and as frequency and ( % percentage) for categorical outcomes. Groups are described as: (Lsmm−Hwc) Low-skeletal muscle mass and high waist circumference. (Lsmm−Lwc) Low-skeletal muscle mass and low waist circumference. (Hsmm−Hwc) High-skeletal muscle mass and high waist circumference. (Hsmm−Lwc) High-skeletal muscle mass and low waist circumference. (a) Denotes significantly different vs. Lsmm−Hwc group. (b) Denotes significantly different vs. Lsmm−Lwc group. (c) Denotes significantly different vs. Hsmm−Hwc group. (Ref.) Reference group. (PAVI) Physical activity of vigorous−intensity. (PAMI) Physical activity of moderate−intensity. (PALI) Physical activity of low−intensity. (†) Daggers denotes significant differences vs. Ref. group at P<0,0001. (#) Analysis performed by Chi-square test at p0,05. (‡) Diabetes prevalence is resulting from participants that adhere to the fasting plasma glucose test. (&) Hypertension prevalence is resulting from participants that adhere to the 3 days blood pressure screening. |
|||||
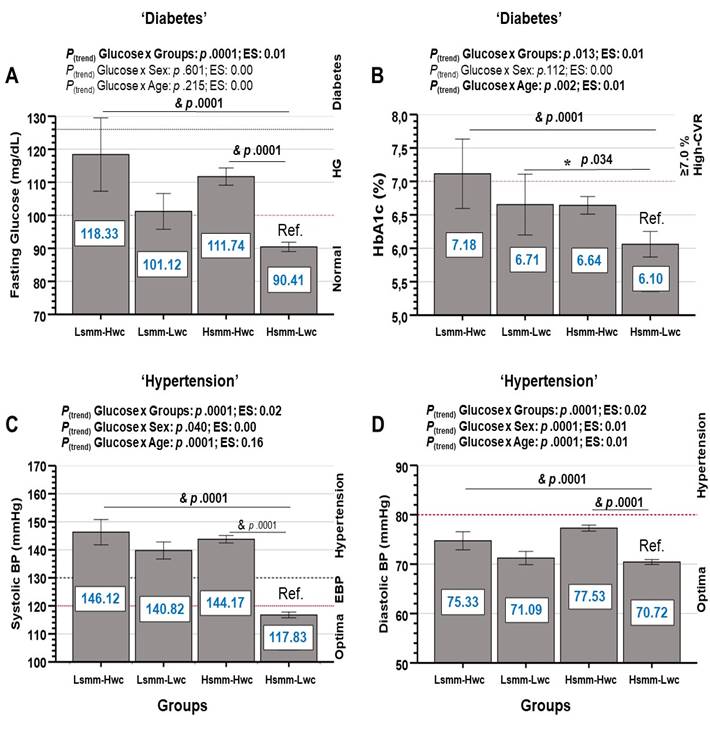
Groups are described as; (Lsmm-Hwc) Low-skeletal muscle mass and high-waist circumference. (Lsmm-Lwc) Low-skeletal muscle mass and low-waist circumference. (Hsmm-Hwc) High-skeletal muscle mass and high-waist circumference. (Hsmm-Lwc) High-skeletal muscle mass and low-waist circumference. (HbA1c) Glycated hemoglobin. (Ref.) Reference group. (HG) Hyper-glycaemia. (CVR) Cardiovascular risk. (EBP) Elevated blood pressure. (*) Between-groups significant differences at p<0,05. (&) Between-groups significant differences at p<0,0001.
Figure 1. Diabetes and arterial hypertension markers in Chilean adults by four different phenotypical models based on the National Health Survey 2016-17 of Chile. Data are shown as mean and (95 %CI).
Linear regression analyses reported that diabetes markers FPG (β = −10,01 [95 % CI] in forward [−11,73; −8,29], P<0,0001), HbA1c (β = −0,34 [−0,47; −0,21], P<0,0001) were significantly associated to muscleness and fatness phenotypes (Table 2). Similarly, arterial hypertension outcomes SBP (β = −13,27 [−14,28; −12.35], P<0,0001), and DBP (β = −2,00 [−2,47; −1,54], P<0,0001) were significantly associated to muscleness and fatness phenotypes (Table 2). Secondary outcomes showed also to be associated with the models, with exception of physical activity (PAVI, PAMI, PALI), and HGS (Table 2).
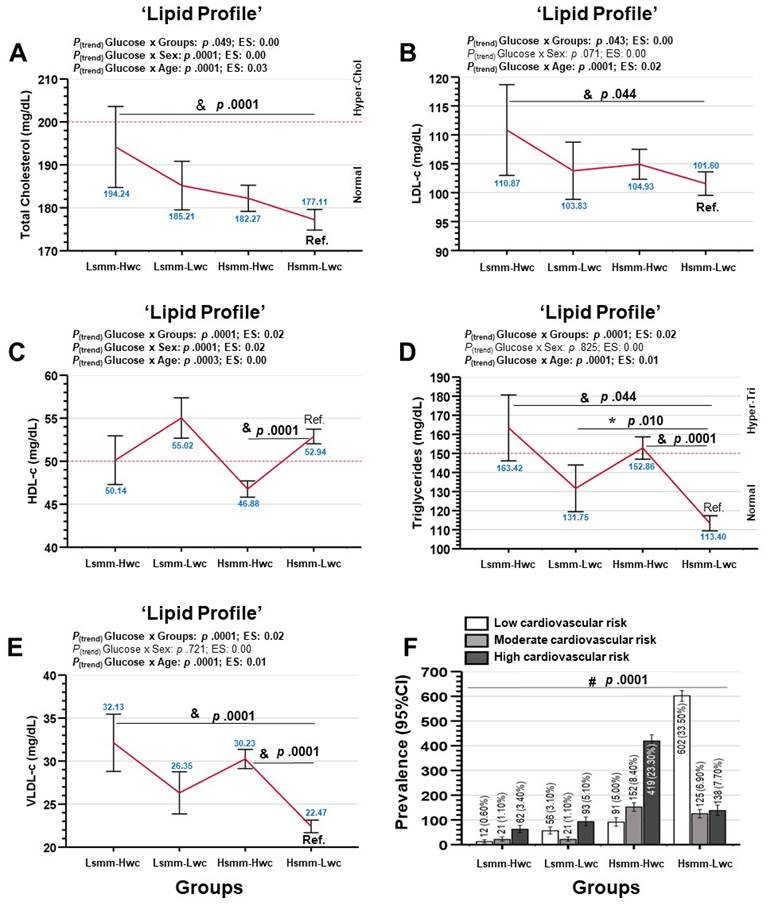
Groups are described as; (Lsmm-Hwc) Low-skeletal muscle mass and high-waist circumference. (Lsmm-Lwc) Low-skeletal muscle mass and low-waist circumference. (Hsmm-Hwc) High-skeletal muscle mass and high-waist circumference. (Hsmm-Lwc) High-skeletal muscle mass and low-waist circumference. (LDL-c) Low-density lipid cholesterol. (HDL-c) High-density lipids cholesterol. (VLDL-c) Very-low density lipids cholesterol. (Ref.) Reference group. (Hyper-chol) Hypercholesterolemia. (Hyper-Tri) Hypertriglyceridemia. (*) Between-groups significant differences at p<0,05. (&) Between-groups significant differences at p<0,0001. (#) Denotes significant differences among groups by Chi square test at p<0,0001.
Figure 2. Dyslipidemia markers and coronary risk in Chilean adults by four different phenotypical models based on the National Health Survey 2016-17 of Chile.
|
Table 2. Association between different cardiometabolic risk factors with four different models of muscleness and fatness based on calf circumference and waist circumference |
|||||
|
Outcomes |
β (95 %CI) |
Beta |
SE |
t-value |
P-value |
|
Anthropometric |
|
|
|
|
|
|
Age (years) |
−15,00 (−15,71; −14,20) |
−0,61 |
0,36 |
−41,13 |
p,0001 |
|
Height (cm) |
1,38 (1,01; 1,75) |
0,13 |
0,18 |
7,36 |
p,0001 |
|
Body mass (kg) |
−2,36 (−2,95; −1,76) |
−0,14 |
0,30 |
−7,74 |
p,0001 |
|
Body mass index (kg·m2) |
−1,40 (−1,62; −1,18) |
−0,22 |
0,11 |
−12,39 |
p,0001 |
|
Waist circumference (cm) |
−6,76 (−7,35; −6,18) |
−0,39 |
0,29 |
−22,60 |
p,0001 |
|
Leg circumference (cm) |
2,68 (2,42; 2,93) |
0,44 |
0,13 |
20,43 |
p,0001 |
|
Diabetes |
|
|
|
|
|
|
Fasting glucose capillary (mg·dL) |
−7,91 (−9,47; −6,35) |
−0,18 |
0,79 |
−9,94 |
p,0001 |
|
Fasting plasma glucose (mg·dL) |
−10,01 (−11,73; −8,29) |
−0,21 |
0,87 |
−11,42 |
p,0001 |
|
HbA1c ( %) |
−0,34 (−0,47; −0,21) |
−0,16 |
0,06 |
−5,10 |
p,0001 |
|
Cardiovascular |
|
|
|
|
|
|
Systolic BP (mmHg) |
−13,27 (−14,28; −12,35) |
−0,43 |
0,51 |
−25,67 |
p,0001 |
|
Diastolic BP (mmHg) |
−2,00 (−2,47; −1,54) |
−0,15 |
0,23 |
−8,46 |
p,0001 |
|
Dyslipidaemia |
|
|
|
|
|
|
Total cholesterol (mg·dL) |
−4,98 (−7,08; −2,87) |
−0,10 |
1,07 |
−4,64 |
p,0001 |
|
Low-density lipids cholesterol (mg·dL) |
−2,44 (−4,23; −0,65) |
−0,06 |
0,91 |
−2,68 |
p,007 |
|
High-density lipoprotein cholesterol (mg·dL) |
1,01 (0,28; 1,75) |
0,06 |
0,37 |
2,72 |
p,006 |
|
Triglycerides (mg·dL) |
−17,5 (−21,43; −13,61) |
−0,19 |
1,99 |
−8,79 |
p,0001 |
|
Very-low density lipids (mg·dL) |
−3,48 (−4,23; −2,74) |
−0,20 |
0,37 |
−9,21 |
p,0001 |
|
Lifestyle |
|
|
|
|
|
|
PAVI (min·week) |
−0,22 (−2,45; 2,00) |
−0,01 |
1,13 |
−0,19 |
p,842 |
|
PAMI (min·week) |
−0,69 (−1,66; 0,27) |
−0,05 |
0,49 |
−1,41 |
p,159 |
|
PALI (min·week) |
−0,01 (−0,82; 0,79) |
−0,00 |
0,41 |
−0,03 |
p,971 |
|
Handgrip strength |
1,99 (−4,10; 8,09) |
0,04 |
3,09 |
0,64 |
p,520 |
|
Sleep time (h·day) |
−0,04 (−0,07; −0,01) |
−0,06 |
0,01 |
−3,22 |
p,001 |
|
Data are shown as mean and (95 %CI) for continuous outcomes, and as frequency and ( % percentage) for categorical outcomes. (PAVI) Physical activity of vigorous−intensity. (PAMI) Physical activity of moderate−intensity. (PALI) Physical activity of low−intensity. Bold Pvalues denotes significant differences between groups at p .05 or less. (#) Analysis performed by Chi-square test at p .05. |
|||||
There was a significant predictive capacity in the diabetes markers FPG (R2 0,048 [4,8 %], r = −0,21, P<0,0001), and HbA1c (R2 0,026 [2,6 %], r = −0,16, P<0,0001), as well as in the HTN marker SBP (R2 0,190 [19,0 %], r = −0,43, P<0,0001), and DBP (R2 0,025 [2,5 %], r = −0,15, P<0,0001) from the four musclenees and fatness phenotypes tested based on CC and WC (Figure 3).

Groups are described as; (Lsmm-Hwc) Low-skeletal muscle mass and high-waist circumference. (Lsmm-Lwc) Low-skeletal muscle mass and low-waist circumference. (Hsmm-Hwc) High-skeletal muscle mass and high-waist circumference. (Hsmm-Lwc) High-skeletal muscle mass and low-waist circumference. (Ref.) Reference group. (FPG) Fasting plasma glucose. (HbA1c) Glycated haemoglobin. (r = ) Pearson coefficient test. (R2) Denotes predictive value in percentage. Red color denotes predictive equation. Blue color percentage value, denotes predictive percentage.
Figure 3. Association between diabetes (panels A-B) and hypertension markers (panels C-D) with four different phenotypical models (based on calf circumference and waist circumference) of Latin-American participants of the Chilean National Health Survey 2016-2017.
DISCUSIÓN
SMM is an important tissue for glucose and blood pressure control,(10,11) and physical inactivity increases the adiposity stores promoting more cardiometabolic risk for diabetes and HTN.(3) In the present study, there was clearly shown that the Ref. group of high-SMM and low-WC reported a better glucose control by FPG 90,4 mg/dL, and appropriate levels of blood pressure by SBP/DBP 117/70 mmHg, highlighting the relevance of maintaining a good SMM and lower levels of adiposity in Latin-American population for avoiding diabetes and HTN risk (Figure 1). Interestingly, the age of the Ref. Hsmm-Lwc group was lower (i.e., 42,1 years) in comparison with the other groups, however, independent of age, literature has shown that when adults and older adults are physically active, the SMM is minimally declined in older adults active, being more important than the chronological age, the PA promotion across the lifetime for sarcopenia prevention,(27) and thus as a pivotal result it is possible the reduction in diabetes(28) and HTN risk.(29) The fitness and fatness phenotypes have been previously explored using CRF (by VO2 max) with WC. For example, Eisenman et al.(30) reported that children/adolescents despite reporting a lower adiposity, when these also reported lower CRF levels were at greater cardiovascular risk. However, little is known about fitness markers using SMM as CC that there was used by the present study.
Previous studies have corroborated the CC outcome as a good indicator of muscle mass and frailty in older adults.(5,18) For example, in a sample of 4,427 adult subjects (age 55,7 y), Suk Park et al,(312) reported that CC significantly correlate with insulin resistance in men and women (r=0,72; r=0,74). In this study additionally, the authors reported that a lower CC and higher weight in the subjects were corresponded also with higher carotid intima-media thickness (cIMT, >0,80 mm), which is an endothelial dysfunction marker, widely known in the physiopathology of the HTN, endothelial dysfunction and atherosclerosis. Although in the present study there was not included vascular outcomes, the Hsmm-Lwc Ref. group showed overall a high percentage of participants classified in low coronary risk (33,5 %) vs. the other groups that reported overall ≤5 % risk (Figure 4).
On the other hand, at secondary outcomes, there was also detected that the same Hsmm-Lwc group also showed lower circulating lipoproteins (Tc [177,1], LDL-c [101,6], Tg [113,4], and VLDL-c [22,4]) than the Lsmm-Hwc model that represented the unhealthier subjects (Figure 2). These results are consistence with previous studies. For example, Arimura et al.(32) reported that HDL-c was better predicted from the WC changes, whereas while lower WC the subjects reported, also higher HDL-c levels were observed in the sample. LaMonte et al.(33) in a wide sample of men (n=9007), and women (n=1491) followed the metabolic syndrome prevalence in these adults that were categorized by tertiles of CRF, where the authors reported an inverse dose-response relationship between CRF and metabolic syndrome, independent of the BMI, and age, where men and women in the two higher tertiles of CRF showed ~21 % (men) and ~42 % (women) reported lower risk of developing metabolic syndrome than men and women with lower CRF, as well as lower LDL-c and lipid disorders.
There was also found that sleep time was associated with the four phenotypes (Table 2). In this line, Meeisinger et al.(34) reported that from (n=4140) men, and (n=4129) women, those subjects with sleep disturbances (i.e., difficulties for sleep maintenance) increase diabetes risk. Other studies have strongly reported that sleep duration (i.e., short or long sleep duration) was an independent predictor of increased cardiovascular risk and death in the population with diabetes diagnosed.(35)
In the present study, and independent of the phenotypical model tested, there was observed that the Hsmm-Lwc showed almost all their main outcomes (glucose and blood pressure control) in better healthy condition than the other Hsmm-Hwc, Lsmm-Lwc, and Lsmm-Hwc groups, being, in addition, this musclenees, and lower fatness, indicators of lower diabetes and HTN prevalence. From here and based on two easy and simply clinical tests as CC and WC, it is of relevance to include the ‘calf circumference’ as an indicator of SMM as well as the ‘waist circumference’ as an adiposity marker for screening in epidemiological studies of both diabetes and HTN trends.
This study has the following limitations; i) there was included a population ≥15 years by resulting of each phenotype modelled (Age [min; max] = Ref. group Hsmm-Lwc [15; 91], Lsmm-Lwc [60; 98], Hsmm-Hwc [60; 95], Lsmm-Hwc [60; 96 years old]) including adolescents/adults/ and older adults of the NHS16-17 that suggest interpreting carefully for future epidemiological comparisons, ii) a percentage of urban and rural were different in each model that could involve a variety of factors for promoting westernized lifestyle, and iii) the PA levels and their intensity were reported using the GPAQv2 questionnaire that could supra or underestimate the real PA practice. As a strength, i) the NHS 2016-17 is a representative study of the Chilean population, ii) there was reported several but widely known health markers of diabetes, HTN, dyslipidemia, fatty liver, hypothyroidism, mineral content to be more informative, and iii) the data information is free available from the epidemiological unit of the Chilean health ministry.
CONCLUSIONS
A high muscleness (based on CC) and low fatness phenotype (based on WC) is present in more young adults, is associated with better glucose and blood pressure control, and overall reports low cardiovascular risk factors for diabetes and HTN in the Chilean population from the NHS16-17.
RECOMMENDATIONS
Future considerations for cross-sectional studies are to add more robust equipment’s (bio-impedance or Dual-x Absorciometry) for body composition analyses and thus to confirm the present findings adding more specificity to the associative relationships reported by the present study.
BIBLIOGRAPHIC REFERENCES
1. Celis-Morales C, Salas C, Alduhishy A, Sanzana R, Martínez MA, Leiva A, et al. Socio-demographic patterns of physical activity and sedentary behaviour in Chile: results from the National Health Survey 2009-2010. Journal of public health (Oxford, England). 2015:1-8.
2. Bull FC, Al-Ansari SS, Biddle S, Borodulin K, Buman MP, Cardon G, et al. World Health Organization 2020 guidelines on physical activity and sedentary behaviour. British journal of sports medicine. 2020;54(24):1451-62.
3. Booth FW, Chakravarthy MV, Gordon SE, Spangenburg EE. Waging war on physical inactivity: using modern molecular ammunition against an ancient enemy. Journal of Applied Physiology. 2002;93(1):3-30.
4. Petermann F, Duran E, Labraña AM, Martínez MA, Leiva AM, Garrido-Mendez A, et al. Risk factors associated with hypertension. Analysis of the 2009-2010 Chilean health survey. Revista medica de Chile. 2017;145(8):996-1004.
5. Pagotto V, Santos KFd, Malaquias SG, Bachion MM, Silveira EA. Calf circumference: clinical validation for evaluation of muscle mass in the elderly. Revista brasileira de enfermagem. 2018;71:322-8.
6. Yi Y, Wang C, Ding Y, He J, Lv Y, Chang Y. Diet was less significant than physical activity in the prognosis of people with sarcopenia and metabolic dysfunction-associated fatty liver diseases: Analysis of the National Health and Nutrition Examination Survey III. Frontiers in Endocrinology. 2023;14:1101892.
7. DeFronzo RA, Gunnarsson R, Bjarkman O, Olsson M, Wahren J. Effects of insulin on peripheral and splanchnic glucose metabolism in noninsulin-dependent (type II) diabetes mellitus. The Journal of Clinical Investigation. 1985;76(1):149-55.
8. Abdul-Ghani MA, DeFronzo RA. Pathogenesis of Insulin Resistance in Skeletal Muscle. Journal of Biomedicine and Biotechnology. 2010;2010.
9. Park JE, Lee S, Kim K. The effect of combining nutrient intake and physical activity levels on central obesity, sarcopenia, and sarcopenic obesity: a population-based cross-sectional study in South Korea. BMC geriatrics. 2023;23(1):119.
10. Kanaley JA, Colberg SR, Corcoran MH, Malin SK, Rodriguez NR, Crespo CJ, et al. Exercise/physical activity in individuals with type 2 diabetes: A consensus statement from the American College of Sports Medicine. Medicine and science in sports and exercise. 2022.
11. Pescatello LS, Buchner DM, Jakicic JM, Powell KE, Kraus WE, Bloodgood B, et al. Physical Activity to Prevent and Treat Hypertension: A Systematic Review. Medicine & Science in Sports & Exercise. 2019;51(6):1314-23.
12. Lee D-c, Sui X, Church TS, Lavie CJ, Jackson AS, Blair SN. Changes in Fitness and Fatness on the Development of Cardiovascular Disease Risk Factors. Journal of the American College of Cardiology. 2012;59(7):665-72.
13. Álvarez C, Cadore E, Gaya AR, Mello JB, Reuter CP, Delgado-Floody P, et al. Associations of cardiorespiratory fitness and obesity parameters with blood pressure: fitness and fatness in youth Latin-American ethnic minority. Ethnicity & Health. 2020:1-17.
14. Cisternas YC, Díaz F, Piñero JC, Lanuza F, Laserre N, Leiva-Ordoñez AM, et al. Prevalencia de obesidad pre-sarcopénica en personas mayores chilenas: Resultados de la Encuesta Nacional de Salud 2016-2017. Revista Española de Nutrición Humana y Dietética. 2023.
15. Patrick J, Bassey E, Fentem P. Changes in body fat and muscle in manual workers at and after retirement. Eur J Appl Physiol Occup Physiol. 1982;49(2):187-96.
16. Pearson M, Bassey E, Bendall M. The effects of age on muscle strength and anthropometric indices within a group of elderly men and women. Age and ageing. 1985;14(4):230-4.
17. Fraiz GM, Gallo LH, Rabito EI, Gomes ARS, Schieferdecker MEM. Relationship between muscle thickness and calf circumference in healthy older women. Archives of Gerontology and Geriatrics. 2020;86:103942.
18. Rolland Y, Lauwers‐Cances V, Cournot M, Nourhashémi F, Reynish W, Rivière D, et al. Sarcopenia, calf circumference, and physical function of elderly women: a cross‐sectional study. Journal of the American Geriatrics Society. 2003;51(8):1120-4.
19. Álvarez C, Ramírez-Campillo R, Miranda-Fuentes C, Ibacache-Saavedra P, Campos-Jara C, Cristi-Montero C, et al. Lifestyle and cardiometabolic risk factors in the ethnic and non-ethnic population> 15 years of age: results from the National Chilean Health Survey 2016-2017. Nutricion hospitalaria. 2023;40(2).
20. Whelton PK, Carey RM, Aronow WS, Casey DE, Collins KJ, Himmelfarb CD, et al. 2017 ACC/AHA/AAPA/ABC/ACPM/AGS/APhA/ASH/ASPC/NMA/PCNA Guideline for the Prevention, Detection, Evaluation, and Management of High Blood Pressure in Adults: Executive Summary: A Report of the American College of Cardiology/American Heart Association Task Force on Clinical Practice Guidelines. Hypertension. 2018;71(6):1269-324.
21. Concha-Cisternas Y, Vásquez-Gómez J, Castro-Piñero J, Petermann-Rocha F, Parra-Soto S, Matus-Castillo C, et al. Niveles de actividad física y tiempo sedente en personas mayores con fragilidad: resultados de la Encuesta Nacional de Salud 2016-2017. Nutricion hospitalaria. 2023;40(1):28-34.
22. WHO. Obesity: preventing and managing the global epidemic. 2000:894:i–xii, 1–253.
23. NCEP. Third Report of the National Cholesterol Education Program (NCEP) Expert Panel on Detection, Evaluation, and Treatment of High Blood Cholesterol in Adults (Adult Treatment Panel III) Final Report. Circulation. 2002;106(25):3143.
24. Poblete-Valderrama F, Rivera CF, Petermann-Rocha F, Leiva AM, Martínez-Sanguinetti MA, Troncoso C, et al. Actividad física y tiempo sedente se asocian a sospecha de deterioro cognitivo en población adulta mayor chilena. Revista medica de Chile. 2019;147(10):1247-55.
25. Díaz-Martínez X, Petermann F, Leiva AM, Garrido-Méndez A, Salas-Bravo C, Martínez MA, et al. No cumplir con las recomendaciones de actividad física se asocia a mayores niveles de obesidad, diabetes, hipertensión y síndrome metabólico en población chilena. Revista medica de Chile. 2018;146:585-95.
26. MINSAL. Informe de Encuesta nacional de Salud 2016-2017. Riesgo Cardiovascular Santiago de Chile: Ministerio de Salud de Chile; 2018 Nov 2018.
27. Zanker J, Sim M, Anderson K, Balogun S, Brennan‐Olsen SL, Dent E, et al. Consensus guidelines for sarcopenia prevention, diagnosis and management in Australia and New Zealand. Journal of Cachexia, Sarcopenia and Muscle. 2023;14(1):142-56.
28. Lakka TA, Aittola K, Järvelä-Reijonen E, Tilles-Tirkkonen T, Männikkö R, Lintu N, et al. Real-world effectiveness of digital and group-based lifestyle interventions as compared with usual care to reduce type 2 diabetes risk–A stop diabetes pragmatic randomised trial. The Lancet Regional Health-Europe. 2023;24:100527.
29. Shakoor H, Platat C, Ali HI, Ismail LC, Al Dhaheri AS, Bosevski M, et al. The benefits of physical activity in middle-aged individuals for cardiovascular disease outcomes. Maturitas. 2023;168:49-52.
30. Eisenmann JC, Welk GJ, Wickel EE, Blair SN. Combined influence of cardiorespiratory fitness and body mass index on cardiovascular disease risk factors among 8–18 year old youth: The Aerobics Center Longitudinal Study. International Journal of Pediatric Obesity. 2007;2(2):66-72.
31. Park JS, Cho MH, Ahn CW, Kim KR, Huh KB. The association of insulin resistance and carotid atherosclerosis with thigh and calf circumference in patients with type 2 diabetes. Cardiovascular diabetology. 2012;11(1):1-8.
32. Arimura S, Moura B, Pimentel GD, Silva ME, Sousa M. Waist circumference is better associated with high density lipoprotein (HDL-c) than with body mass index (BMI) in adults with metabolic syndrome. Nutricion hospitalaria. 2011.
33. LaMonte MJ, Barlow CE, Jurca R, Kampert JB, Church TS, Blair SN. Cardiorespiratory fitness is inversely associated with the incidence of metabolic syndrome: a prospective study of men and women. Circulation. 2005;112(4):505-12.
34. Meisinger C, Heier M, Loewel H. Sleep disturbance as a predictor of type 2 diabetes mellitus in men and women from the general population. Diabetologia. 2005;48(2):235-41.
35. Han H, Wang Y, Li T, Feng C, Kaliszewski C, Su Y, et al. Sleep Duration and Risks of Incident Cardiovascular Disease and Mortality Among People With Type 2 Diabetes. Diabetes Care. 2023;46(1):101-10.
Acknowledgements
The authors would like to say thank you to all participants for their cooperation and to the Chilean Health Ministry and School of Public Health of The Pontificia Universidad Católica de Chile for commissioning, designing, and conducting the NHS 2016-17.
FINANCING
No financing.
CONFLICT OF INTEREST
The authors declare that there is no conflict of interest.
AUTHORSHIP CONTRIBUTION
Conceptualization: Cristian Alvarez, Pedro Delgado-Floody
Data curation: Pedro Delgado-Floody
Formal analysis: Cristian Alvarez
Research: Cristian Alvarez
Methodology: Cristian Alvarez
Project management: Cristian Alvarez
Resources: Christian Campos-Jara
Software: Cristian Alvarez
Supervision: Cristian Alvarez
Validation: Cristian Alvarez, Christian Campos-Jara, Francisco Guede-Rojas, Claudia Marchant, Lorena Martínez-Ulloa, Igor Cigarroa, Jaime Vásquez-Gómez, Carmen Luz Muñoz-Mendoza, Cristian Caparros-Manosalva.
Drafting - original draft: Cristian Alvarez, Christian Campos-Jara, Francisco Guede-Rojas, Claudia Marchant, Lorena Martínez-Ulloa, Igor Cigarroa, Jaime Vásquez-Gómez, Carmen Luz Muñoz-Mendoza, Cristian Caparros-Manosalva.
Writing - proofreading and editing: Cristian Alvarez, Christian Campos-Jara, Francisco Guede-Rojas, Claudia Marchant, Lorena Martínez-Ulloa, Igor Cigarroa, Jaime Vásquez-Gómez, Carmen Luz Muñoz-Mendoza, Cristian Caparros-Manosalva.