ORIGINAL ARTICLE
Response surface methodology approach in achieving multi-response setup optimization in the machining process
Enfoque de la metodología de superficie de respuesta para lograr la optimización de la configuración multirrespuesta en el proceso de mecanizado
Yohanes T. Wibowo1,2 ![]() *,
Nurhadi Siswanto1
*,
Nurhadi Siswanto1 ![]() *, Mokh Suef1
*, Mokh Suef1 ![]() *
*
1Institut Teknologi Sepuluh Nopember. Department of Industrial and Systems Engineering. Surabaya, Indonesia
2Institut Teknologi Sepuluh Nopember. Department of Industrial and Systems. Surabaya, Indonesia
Cite as: Wibowo TY, Siswanto N, Suef M. Response surface methodology approach in achieving multi-response setup optimization in the machining process. Salud Cienc. Tecnol. 2022;2(S2):190. https://doi.org/10.56294/saludcyt2022190
Submitted: 18-11-2022 Revised: 13-12-2022 Accepted: 26-12-2022 Published: 31-12-2022
Editor: Fasi Ahamad
Shaik ![]()
ABSTRACT
A machining cost is constructed on many factors. All aspects potentially raise the additional charges resulting from not achieving dimension due to tool wear level. The accuracy of parameters determines the effectiveness of the machining process. However, these parameters are sensitive, so the different machines may not provide the same performance. The specific machining parameters become less suitable for others. This experimental approach is proposed to obtain the parameter used on other machines without reducing the performance. This multi-response study used a response surface methodology by selecting the material removal area, feed rate, spindle speed, and the number of repetitions as input have a dominant influence on the tool wear and the dimension deviation. A comprehensive range with the specified target is obtained by applying different weights. Testing on 11 units of machines from 3 other countries provides the same performance and contributes to saving 15 % of machining time.
Keywords: Machining Parameter; Multi Response Optimisation; Tool Wear; Dimension Deviation.
RESUMEN
El coste de mecanizado depende de muchos factores. Todos los aspectos aumentan potencialmente los cargos adicionales resultantes de no alcanzar la dimensión debido al nivel de desgaste de la herramienta. La precisión de los parámetros determina la eficacia del proceso de mecanizado. Sin embargo, estos parámetros son sensibles, por lo que las distintas máquinas pueden no ofrecer el mismo rendimiento. Los parámetros de mecanizado específicos se vuelven menos adecuados para otros. Se propone este enfoque experimental para obtener el parámetro utilizado en otras máquinas sin reducir el rendimiento. Este estudio multirrespuesta utilizó una metodología de superficie de respuesta seleccionando el área de eliminación de material, la velocidad de avance, la velocidad del husillo y el número de repeticiones como entrada tienen una influencia dominante en el desgaste de la herramienta y la desviación de la dimensión. Aplicando diferentes ponderaciones se obtiene una gama completa con el objetivo especificado. Las pruebas realizadas en 11 unidades de máquinas de otros 3 países proporcionan el mismo rendimiento y contribuyen a ahorrar un 15 % del tiempo de mecanizado.
Palabras clave: Parámetro de Mecanizado; Optimización Multirrespuesta; Desgaste De Herramienta; Desviación
INTRODUCTION
Quality is one of the fundamental and essential factors in the production process. Quality connects the voice of business with the voice of the customer.(1) Quality generally relates the company with other actors to support business activities in the manufacturing world. To help the manufacturing process, companies need industrial machines to carry out the machining process and make products according to customer needs. It takes customers who need and buy the product to make a profit. It clearly explains the relationship between industry, customers, and machining processes. A good machining process that meets quality standards and requires a short processing time must be achieved. In the machining process, many topics are ready to use for discussion. By reviewing the process actors, quality standards, the processing time required, and the interaction between these things, fulfilling the factors according to the objectives can be better fulfilled. The modeling study consists of these factors.
Objectives in manufacturing companies are quality, cost, and delivery. They are the components of products and services.(2) Along with the times, the objective is defined as quality, speed, and cost as a project management triangle.
Then narrowed again as an economic purpose consisting of survival, profit, and earning.(3) In a more operative word, quality is described as short processing time, good results that meet technical demands, and low costs. The industry should understand customer tends to purchase quality products at timely and appropriate prices. In simple words, the industry must provide competitive advantages. Therefore, real-life problem solutions often aim to find less expensive, more effective ways of production and another trade of technical requests without compromising or even sacrificing product quality. In the machining world, many things support the achievement of economic purpose. The machining process can maintain industrial existence by matching technical standards and minimizing the dimension deviation. The level of cutting tool wear is also a different matter but supports the achievement of dimension deviation. Defining industrial objectives can be taken through the stages of the optimization process.
Optimization of the machining process through research models has been widely carried out. The optimization process used various approach techniques. They will keep being used in line with the more advanced equipment, the more multiple tools and machines, and the development of technology. Milling machines that have been numerically controlled are industrial machines widely used as optimization objects. The consideration of milling machines is due to their low energy efficiency(4) and high population.(5,6) Milling machines' general efficiency is around 14,8 %.(5) Taking this into account, the optimization of milling machines in the machining process in the manufacturing world is an urgent matter to be addressed immediately.(7,8)
Both companies and experts always carry through to achieve this goal using mathematical and statistical optimization techniques. In previous studies, several optimization methods used were empirical studies, meta-heuristics methods, response surface methodology, and other methods. In research, the model setup is specific, so the research results are also specific. The implication is that implementing optimization results is not generally so that positive research results greet the public less through their contributions. The higher variation of the machine and the narrowness of the research object create gaps that impact the need to redo the optimization process for each type of CNC milling machine. This activity will undoubtedly lead to research inefficiency because the broadness of science does not develop. In a situation like this, it is necessary to conduct a study that can carry out an optimization process that can accommodate variations in the types and capabilities of machines in a manufacturing process.
A known statistical and mathematical technique used to be employed for modeling and optimizing experimental design is Response Surface Methodology (RSM).(9) It is very sophisticated in optimization tools since it takes only a tiny amount of experimentation. Besides, it can model and optimize the data. Usually, the researchers use this tool in an experimental laboratory to find the optimum yield or reaction. However, RSM can also be used in engineering applications, management studies(10) and simulation optimization of the multi-line of production.(11) Some studies also have used RSM in cutting parameter variation-based machine optimization. Still, it will be reviewed in the next chapter of this article how perfect the RSM as a statistical and mathematical tool modeling to optimize machine process problems in a multi-response and multi machines nowadays.
In the following section, RSM will be explained in machine optimization research and how important it is. Also, there would be a numerical experiment using case studies of how response surface modeling should be used in the machine optimization scope. Considering how the different machine responses come from both of the same and different ones in a specific cutting parameter is a probabilistic problem that will lead us to why RSM in machine optimization research is an interesting topic to be reviewed.
Streams on Optimisation
The related research in the manufacturing industry optimization is divided into three streams with different focuses. The first stream is machining optimization through the machining variable variation approach to get the optimal point in the machining process. The second stream is research that uses specific optimization methods, such as mathematical methods for single or multi-objectives. At the same time, the third group focuses on general cutting tool condition variables and typical cutting tool wear. Although there are three streams, researchers often switch streams in each publication. In general, the stream is not visible, but it is visible in research publications. One commonality that becomes the red line of the three streams is that all optimization research has an objectivity that revolves around fulfilling quality, reducing costs, or reducing time.
The first stream begins with research that shows a relationship between variations in machining parameters and power consumption, and the level of wear and tear of cutting tools or the service life of cutting tools.(12) Further publications on parameter optimization using the response surface methodology stated that machining parameters are essential things that have been neglected.(13) Extending the research, the experimentation suggested that setting the spindle speed can reduce energy costs(14) in the CNC turning machining process.(15) The online monitoring system model was first introduced in an empirical study that pays attention to the objective function of surface roughness.(15) The monitoring system is confirmed in his research.(16) Cutting parameters stated that changes in spindle speed affect energy consumption,(17) which continued that process planning and machining parameters affect operational costs.(18) This is in line with what the researcher stated in his writing that the variation of parameters affects the machining results or product quality on various machines.(19) In another study, the Nelder-Mead technique was used through various parameters for the optimization process.(20) The researchers can also apply the management of cutting parameters for optimization processes to milling machines in general and micro milling in particular.(21) The summary above summarizes the first stream in the engine optimization process.
In his research, a process of minimizing machining time was carried out to reduce energy consumption in milling machines using the genetic algorithm optimization method.(22) The researchers adopted this model for another machine, namely the turning machine.(23) Research on the cutting tool's life found that it is influenced and connected to tool wear.(24) The energy consumption prediction model is introduced.(25) In a follow-up study related to the energy consumption of the x-axis motor, the resulting state that the surface roughness was affected by the machining parameters.(26) The simulated annealing optimization method is used to minimize energy consumption.(27) The subsequent research raises the topic of cutting tool wear as one of the factors that affect energy consumption,(21,28) power consumption efficiency, tool wear,(21,29) and machining models in other processes.(30) These are studies in the second stream group.
In stream 3, in research related to tool wear, it is stated that energy, tools wear, and costs are interrelated (24). The role of tool wear is explained,(29) which strengthens the opinion that tools wear and cutting parameters are essential to carry out optimization.(21) The tool wear level is one thing that needs to be monitored(28) so that it can access data to a higher level seamlessly on micro milling.(21)
Based on the literature study followed by further analysis, the independent variables are removal area, spindle speed, and repetition representing duration and machine type. In contrast, the dependent variables are tool wear and dimension deviation. The new independent variable is machine type. Due to the high cost of research consideration, the lack of access to various machines, and the machine population consisting of tens of brands and series of machines available in the industry, machine type is usually avoided from being used as a variable. It is hard to find the previous research using the machine type as independent, complementing the four other variables selected due to their significant contribution to the machining process. The Dimension deviation variable is also rarely used due to the activity's complexity of carrying precise measuring instruments out of the measurement room and the difficulty of in-process dimensioning when the specimen is still attached to the machine.
Finally, in this study, the RSM method was used to show the contribution of parameters that affect tool wear and dimension deviation. The cutting parameters are material removal rate, feed rate, spindle speed, and repetition, as well as the relationship between the variables on tool wear and dimension deviation.
METHODS
Response Surface Methodology
RSM is a widely used combined technique of statistical and mathematical to build, develop, and optimize a process. The design of experimental techniques is employed to improve the quality. The applications are to design and formulate experimental designs.(9) Thanks to the RSM technique, it requires a minimum number of experiments. RSM has an application to see affected variables in single or multiple characteristics of the responses. RSM has three variables: independent, response, and categorical. Response variables are the performance value of a variable that can sometimes be called the dependent variable. Independent variables are a subject of a control parameter within an experiment. The categorical variable is also a variable that contains values indicating membership in one of several possible categories. In practice, the categorical variables must be handled separately by comparing our best-operating conditions concerning the quantitative variables across different combinations of the categorical ones.
RSM began from designing until the optimization phase of the experiment. RSM assumes that the independent variables are not correlated and have a significant value to the response, so it still needs other statistical tools to analyze the model. Analysis of variance was used to find if the model is significant to the data. The correlation regression test was used to see if the model has a correlation and determination value. RSM has two kinds of design experiments often used by the researcher, Box-Behnken Design (BBD) and Central Composite Design (CCD). Box-Behnken Design (BBD) is formed from three-level design efficiency that was designed from an imperfect block design. Box-Behnken Design doesn't have an embedded factorial design. It also doesn't have an extreme point. CCD is the evolution of sequential experiments from two-level factorial.
Multi-Response Optimisation
In real-life cases, there is more than one response that the industry must optimize simultaneously. They should reduce the cost while product quality keeps improving or even better. Then the decision they are making is more difficult when conflicting conditions exist. For this reason, multi-response optimization is an essential perfect tool to study. Problems in multi-response forms have more than one response to a given situation. This study optimized a manufacturing problem with five responses by applying RSM and two objective functions or performance. Optimization of all responses simultaneously is possible by combining them into a single objective function, which represents the relationship of all responses that are to be optimized.(31)
Variables on Machining Process
The specimen material used in this study was C45 with a size of 200mm x 150mm x 60mm, which was processed using a CNC milling machine. The researchers chose this material because it is widely used for general industrial needs. For material homogeneity reasons, the material hardness of each specimen was measured using the Mitutoyo Hardness Testing Machine, Wizhard HR-522 series. The unit used in the measurement results is Rockwell hardness (HRc). The cutting tools used are end mill cutters with the TAP300R-2020-160 series, namely, end mill cutters with a diameter of 20 mm. This cutting tool has 2 Kyocera brand carbide inserts with the APMT1135PDER-KZ-A series. A new carbide insert is used in every new specimen's dry-cutting milling machining process. The measuring instrument used to measure the wear of the cutting tools is Laser Control with the Micro Compact NT series. In contrast, the measuring device for measuring the dimensions of the specimen is the Coordinate Measuring Machine (CMM) Brand Brown & Sharpe Global Performance 5.5.5. The CNC milling machines used are Makino brand machines with the KE-55 (KE) series made in China, Makino series S33 (SE) made in Singapore, and Brother (BR) made in Japan, as shown in figure 1.
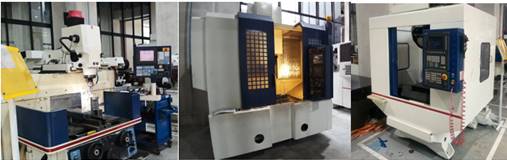
Figure 1. The Machines: Makino KE-55, Makino S-33 dan Brother.
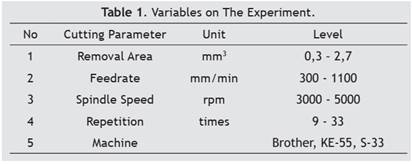
The cutting parameter levels used in experiments are shown in Table 1.
Technical Procedures
Several procedures used in the study are described at this stage to ensure validity. These steps are activities that are carried out in a precise order. The homogeneity test procedure was carried out to measure the hardness of the material of a specimen five times in a line position along the workpiece. The machining procedure uses a zig-zag toolpath strategy with machining parameters, as shown in table 2, for every 1-time machining process. The cutting tool is a 2-edged endmill cutter with a diameter of 20mm and the carbide insert cutting edge of APMT1135PDER-KZ-A series. The cutting blade used for each specimen is the same and uniform for all specimens. The Micro Compact NT, a non-contact and optical laser-based device, was used to measure the outer edge of the cutting edge. The wear value is obtained by comparing the results of the last measurement with the initial measurement. Tool wear measurements are made with the cutting tool still installed in the machine. The specimen measurement to observe the dimensional deviation was carried out using CMM Brand Brown & Sharpe, which was carried out in the measurement room after the specimen underwent the machining and deburring process.
RESULT
The following chapter will describe numerical experiments, experimental results, and a discussion of these experiments. The results and discussion will describe and explain further the answers to this research problem and the discussion around it. It also contains the value of the data processing results that leads to the analysis, which is enriched by discussion into conclusions.
Experiment Result
Measurements were made on each specimen that has passed the machining process using specific cutting parameters. In each specimen machining process, a new cutting tool was used, which has never been used before. The cutting parameters used in the experiment and the responses that appear are shown in table 2.
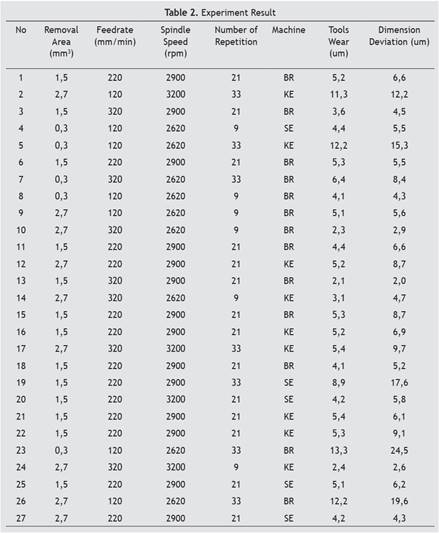
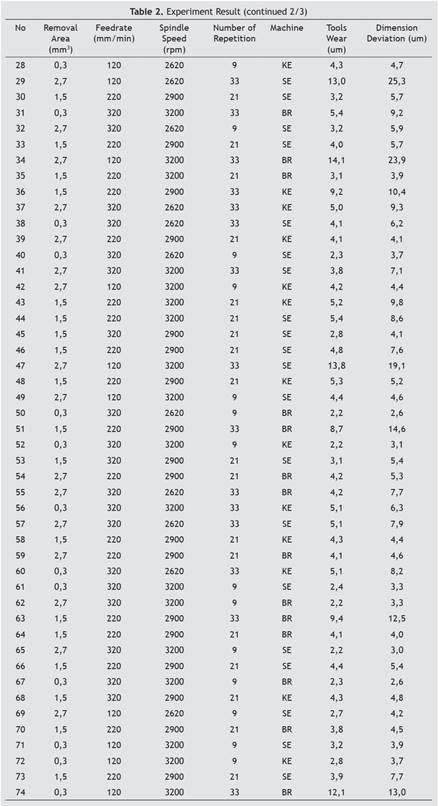
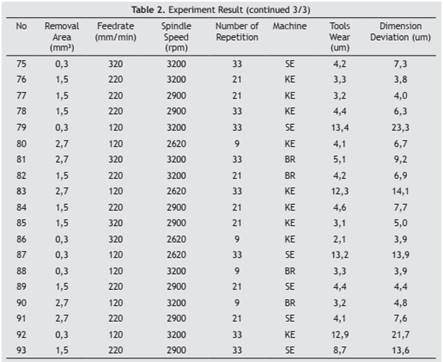
Based on the experimental data and responses in Table 2, a numerical experiment was carried out using RSM. The data were obtained from numerical experiments. The contribution of the feedrate and repetition variables was the dominant one for the tool wear response, both independently and when the two variables interacted—likewise, the dimensional deviation response. The feedrate and repetition variables also contribute dominantly. The results of other numerical experiments are presented in the following tables and figures.
Figure 2. Contour Plot of Tools Wear on Brother Machine
Figure 3. Contour Plot of Tools Wear on Makino KE-55 Machine
Figure 4. Contour Plot of Tools Wear on Makino S-33 Machine.
Figures 2, figure 3, and figure 4 describe the role and value of feedrate and repetition concerning the value of tools wear for each machine. Figure 5, figure 6 and figure 7 describe the same variables concerning the value of dimension deviation. The lighter of green color, the fewer tools wear while the darker of blue color, the fewer dimension deviation.
Figure 5. Contour Plot of Dimension Deviation on Brother Machine
Figure 6. Contour Plot of Dimension Deviation on KE-55 Machine.
Figure 7. Contour Plot of Dimension Deviation on S-33 Machine.
Figure 8, it is depicted in a surface the interaction pattern among feedrate, repetition, and tools wear in a 3-dimensional figure. Figures 8, 9, and 10 explain the interaction among variables related to response tools wear on the Brother, Makino KE-55, and Makino S-33 machines. Figures 11, 12, and 13 explain the interaction among variables related to response dimension deviation on the Brother, Makino KE-55, and Makino S-33 machines.
Figure 8. Surface Plot of Tools Wear on Brother Machine.
Figure 9. Surface Plot of Tools Wear on Makino KE-55 Machine.
Figure 10. Surface Plot of Tools Wear on Makino S-33 Machine.
Figure 11. Surface Plot of Dimension Deviation on Brother Machine.
Figure 12. Surface Plot of Dimension Deviation on Makino KE-55 Machine.
Figure 13. Surface Plot of Dimension Deviation on Makino S-33 Machine.
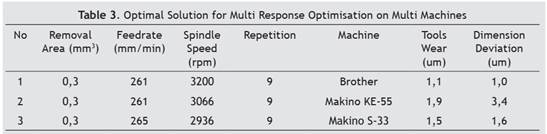
The machining parameter values that provide the optimal solution for the existing conditions are obtained based on the iterations on RSM. The existing multi-objectives are based on the response during the machining process. Combinations and details of cutting parameters shown in Table 3 are the value created by RSM iteration to achieve the optimal solution with objectives of fewer tool wear and less dimension deviation for the three machines. The values produced are not the same for all three machines. There are two versions of feed rate and spindle speed. All values shown in Table 3 are the result of numerical experiment.
Result Validation
In this chapter, the validation process by implementing the cutting parameter values was carried out to confirm the response predicted by RSM.
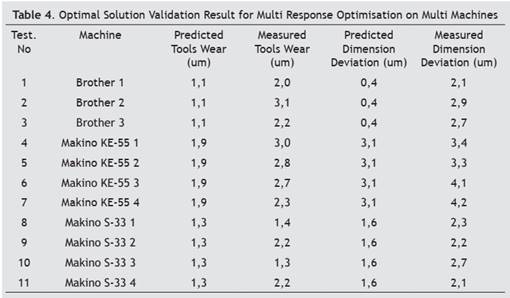
Based on Table 3, the experiment was repeated using these cutting parameters. The total number of machines used was 11 CNC milling machines with different brands, series, and countries of manufacturers. One specimen was tested on each machine. After the machining process was complete, tools and specimens were measured using the same instruments used in the previous experimental process. The responses that appear were recorded and compared with the response values of the predicted results of mathematical experiments, as shown in Table 4. Through this validation process, the prediction performance of the numerical experiment results was observed and validated.
DISCUSSION
In the optimization process in this study, RSM used 93 specimens. In this study, variations were made on the removal rate, feed rate, spindle speed, repetition, and machine. The tools wear and dimension deviation variables are selected for the response variable. The selection of variables is based on previous studies by considering the research results and the existing gaps. By utilizing the RSM technique, information on cutting parameter values is obtained that can provide an optimal solution in the form of lower tool wear and minimal deviation dimensions.
The cutting parameter values were tested in the actual machining case in the validation stage. The cutting parameter values were tested to see if the optimal solution offered by RSM can provide the optimal solution as a multi-response setup on multi machines. Based on Table 4, the tool's measured value close to the predicted value can be observed. Likewise, the actual value of the dimension deviation number was close to the predicted dimension deviation. Based on the actual value relative to the predicted value, the researchers can conclude that using RSM for the optimization process has answered the current needs. Another conclusion that RSM can be used for process improvement in the engineering field(10) is proper. The research confirmed the tool wear rate model using RSM at the validation stage, and the data obtained that the most significant deviation of 2 um occurred only once.
In comparison, the tool wear deviation less than 1 um occurred 8 times and the last three is between 1 and 2 um. Likewise, dimension deviation validation provides data that there are two deviations (18 %) between 2 and 2,5 um, four deviation (36 %) between 1 and 2 um, and the remaining five (45 %) less than 1 um. If we assume that the allowable tool wear deviation between prediction and actual is less than 2 um, then the reproducibility of tool wear is 91 %, and 82 % for dimension deviation. The prediction accuracy level for tools wear, and dimension deviation is also in the same number.
With this description, the proposed model convincingly shows a good and satisfactory level of accuracy and reproducibility. In addition, the result shows the cut tool's wear rate is affected by the feed rate, and the number of repetitions is correct. Feed rate and repetition contribute dominantly to tools wear rate and dimension deviation independently and when interacting. The relationship between feed rate and repetition is reciprocal. The greater the number of repetitions, the greater the tools wear. Likewise, with feed rate. The higher the feed rate, the greater the tools wear.
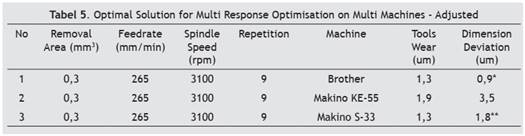
The industry has many machines to manage. Emerging needs lead to buying a variety of machines. This variety of machines provides the advantage of a wide range of machining capabilities to accommodate needs. On the other hand, these variations also require intensive attention so that there are no errors in the selection of cutting parameters. The most important thing is that a specific optimization process is needed for the machine. Considering advantage and constraint, adjustments to the value in Table 3 are made, so one value is applicable for various machines with the appropriate level of tool wear and dimensional deviation. Details of adjusted cutting parameters that provide optimal solutions for multi-response setups for multi-machines can be seen in Table 5. The * sign indicates the cutting parameter value offers better performance, and ** indicates the response value is slightly reduced but still in a suitable category. Table 5 shows a summary of all cutting parameter values that provide optimal solutions for multi-response on multi objects or multi machines where all machines have different series and brands.
In real-life industry, the most representative of quality is the product dimension. In the implementation of cutting parameters as shown in Table 5, specifically in the finishing process, the dimensional deviation result of the product was according to the predictions. In the previous standard machining process, the finishing process was carried out twice after the semi-finishing process. However, with the implementation of the cutting parameter value, the finishing process was only carried out once, and the requested dimension has been reached and is within the tolerance value. In general, applying this cutting parameter can reduce the finishing process, and there is a machining time saving of 15 %.
CONCLUSION
This paper was intended to answer a specific machine optimization model that is only suitable for single machine setups with the same machine and setup details. Differences in brands, machine series, and process setups are believed not to be used as optimization objects if they take parameters with different configurations. Several previous studies have been described in preliminary research. This machining setup selects the cutting parameters that have a dominant contribution to the machining process. The optimization process uses RSM techniques. In this study, it has been shown that the feed rate variable and the number of repetitions have a dominant contribution to tools wear and dimension deviation, and RSM is an essential and perfect tool for optimizing with multi-response setups on multi objects and optimization model based on multi-response on multi-object has been carried out and validated convincingly. This research has just performed multi-response optimization on multi objects (multi machines). However, this optimization only takes machines made in Asian countries and has not taken machines made in European countries. Therefore, in future work, the researchers must continue to find a multi-response optimization model for multi-machines from different countries or continents where the concepts and values of making machines differ.
REFERENCES
1. Schoenfeldt TI. A Practical Application of Supply Chain Management Principles. ASQ Quality Press; 2008.
2. Manalo RG, Manalo MV. Quality, Cost and Delivery performance indicators and Activity-Based Costing. In: 2010 IEEE International Conference on Management of Innovation & Technology [Internet]. Singapore, Singapore: IEEE; 2010 [cited 2022 Aug 29]. p. 869–74. Available from: http://ieeexplore.ieee.org/document/5492805/
3. Oprea R. Survival Versus Profit Maximization in a Dynamic Stochastic Experiment. Econometrica. 2014;82(6):2225–55.
4. Wojcicki J. Energy Efficiency of Machine Tools [Doctoral Thesis]. Politecnico di Milano; 2017.
5. Pavanaskar S. Improving Energy Efficiency in CNC Machining [Internet] [Doctoral Thesis]. University of California; 2014. Available from: https://books.google.co.id/books?id=VDArngAACAAJ
6. Wang SM, Lee CY, Gunawan H, Yeh CC. An Accuracy-Efficiency-Power Consumption Hybrid Optimization Method for CNC Milling Process. Applied Sciences. 2019 Apr 10;9(7):1495.
7. Singh G, Aggarwal V, Singh S. Critical review on ecological, economical and technological aspects of minimum quantity lubrication towards sustainable machining. Journal of Cleaner Production. 2020 Oct;271:122185.
8. Ming W, Shen F, Zhang G, Liu G, Du J, Chen Z. Green machining: A framework for optimization of cutting parameters to minimize energy consumption and exhaust emissions during electrical discharge machining of Al 6061 and SKD 11. Journal of Cleaner Production. 2021 Feb;285:124889.
9. Myers RH, Montgomery DC, Cook CMA. Response Surface Methodology: Process and Product Optimization using Designed Experiments. 3rd ed. Vol. 39. New Jersey: JOhn Wiley & Sons; 2009.
10. Zahraee SM, Rohani JM, Wong KY. Application of computer simulation experiment and response surface methodology for productivity improvement in a continuous production line: Case study. Journal of King Saud University - Engineering Sciences. 2018 Jul;30(3):207–17.
11. Dengiz B, Belgin O. Simulation optimization of a multi-stage multi-product paint shop line with Response Surface Methodology. SIMULATION. 2014 Mar;90(3):265–74.
12. Bhushan RK. Optimization of cutting parameters for minimizing power consumption and maximizing tool life during machining of Al alloy SiC particle composites. Journal of Cleaner Production. 2013 Jan;39:242–54.
13. Camposeco-Negrete C. Optimization of cutting parameters using Response Surface Method for minimizing energy consumption and maximizing cutting quality in turning of AISI 6061 T6 aluminum. Journal of Cleaner Production. 2015 Mar;91:109–17.
14. Lv J, Tang R, Jia S, Liu Y. Experimental study on energy consumption of computer numerical control machine tools. Journal of Cleaner Production. 2016 Jan;112:3864–74.
15. Zhong Q, Tang R, Lv J, Jia S, Jin M. Evaluation on models of calculating energy consumption in metal cutting processes: a case of external turning process. Int J Adv Manuf Technol. 2016 Feb;82(9–12):2087–99.
16. Wibowo YT, Baskoro SY, Manurung VAT. Toolpath Strategy and Optimum Combination of Machining Parameter during Pocket Mill Process of Plastic Mold Steels Material. In: Materials Science and Engineering Conference Series. 2018. p. 012137. (Materials Science and Engineering Conference Series; vol. 306).
17. Hu L. Sequencing the features to minimise the non-cutting energy consumption in machining considering the change of spindle rotation speed. Energy. 2017;12.
18. Li, Lingling, Li C, Tang Y, Li L. An integrated approach of process planning and cutting parameter optimization for energy-aware CNC machining. Journal of Cleaner Production. 2017 Sep;162:458–73.
19. Wibowo YT, Manurung V, Kosasih K. Experimental Study on Plastic Mold Steel Reaming Process using Taguchi Method. In: 2018 International Conference on Applied Science and Technology (iCAST). 2018. p. 559–62.
20. Lee Y, Resiga A, Yi S, Wern C. The Optimization of Machining Parameters for Milling Operations by Using the Nelder–Mead Simplex Method. JMMP. 2020 Jul 5;4(3):66.
21. Zhang X, Yu T, Dai Y, Qu S, Zhao J. Energy consumption considering tool wear and optimization of cutting parameters in micro milling process. International Journal of Mechanical Sciences. 2020 Jul;178:105628.
22. Hu L, Tang R, Liu Y, Yanlong Cao, Tiwari A. Optimising the machining time, deviation and energy consumption through a multi-objective feature sequencing approach. Energy Conversion and Management. 2018;15.
23. Jiang Z, Gao D, Lu Y, Kong L, Shang Z. Electrical energy consumption of CNC machine tools based on empirical modeling. The International Journal of Advanced Manufacturing Technology [Internet]. 2018; Available from: https://doi.org/10.1007/s00170-018-2808-x
24. Shi KN. A Novel Energy Consumption Model for Milling Process Considering Tool Wear Progression. Journal of Cleaner Production. 2018;179:22.
25. Lv J, Tang R, Tang W, Liu Y, Zhang Y, Jia S. An investigation into reducing the spindle acceleration energy consumption of machine tools. Journal of Cleaner Production. 2016;1–10.
26. Öztürk B, Uğur L, Yildiz A. Investigation of effect on energy consumption of surface roughness in X-axis and spindle servo motors in slot milling operation. Measurement. 2019 Jun;139:92–102.
27. Hu L, Tang R, Cai W, Feng Y, Ma X. Optimisation of cutting parameters for improving energy efficiency in machining process. Robotics and Computer-Integrated Manufacturing. 2019 Oct;59:406–16.
28. Hassan M, Sadek A, Attia MH. Novel sensor-based tool wear monitoring approach for seamless implementation in high speed milling applications. CIRP Annals. 2021;70(1):87–90.
29. Shankar S, Mohanraj T, Rajasekar R. Prediction of cutting tool wear during milling process using artificial intelligence techniques. International Journal of Computer Integrated Manufacturing. 2018 Nov 26;
30. Zhao G, Li C, Lv Z, Cheng X, Zheng G. Specific energy consumption prediction model of CNC machine tools based on tool wear. International Journal of Computer Integrated Manufacturing. 2020 Feb 1;33(2):159–68.
31. Akçay H, Anagün AS. Multi Response Optimization Application on a Manufacturing Factory. MCA. 2013 Dec 1;18(3):531–8.
CONFLICTS OF INTEREST
None
FUNDING
This research funding was obtained from the Directorate of Research, Technology, and Community Service; Ministry of Education, Culture, Research, and Technology; the Republic of Indonesia, in accordance with the Main Contract for Doctoral Dissertation Research Scheme under Grant Number 084/E5/PG.02.00.PT/2022 and 1409/PKS/ITS/2022.
AUTHORSHIP CONTRIBUTION
Conceptualization: Yohanes T. Wibowo, Nurhadi Siswanto, Mokh Suef.
Methodology: Yohanes T. Wibowo, Nurhadi Siswanto, Mokh Suef.
Writing - Original Draft: Yohanes T. Wibowo, Nurhadi Siswanto, Mokh Suef.
Writing - Review & Editing: Yohanes T. Wibowo, Nurhadi Siswanto, Mokh Suef.