doi:
10.56294/saludcyt2024.1350
SYSTEMATIC REVIEW
Head Circumference and Cognitive Outcome in IUGR: A Systematic
Review and Meta-Analysis
Circunferencia craneal y resultados
cognitivos en el RCIU: Una revisión sistemática y metaanálisis
Galih Indra Permana1,2  , Viskasari Pintoko Kalanjati3 *,
Rimbun Rimbun3 , Abdurachman Abdurachman3
, Viskasari Pintoko Kalanjati3 *,
Rimbun Rimbun3 , Abdurachman Abdurachman3 
1Master
of Basic Medical Sciences in Anatomy and Histology, Faculty of Medicine,
Universitas Airlangga. Surabaya, Indonesia.
2Department
of Anatomy and Histology, Faculty of Medicine, Universitas Palangka. Raya,
Indonesia.
3Department
of Anatomy, Histology and Pharmacology, Faculty of Medicine, Universitas
Airlangga. Surabaya, Indonesia.
Cite
as:
Permana GI, Kalanjati VP, Rimbun R, Abdurachman A. Head Circumference and
Cognitive Outcome in IUGR:A Systematic Review and Meta-Analysis. Salud, Ciencia
y Tecnología. 2024; 4:.1350. https://doi.org/10.56294/saludcyt2024.1350
Submitted: 05-03-2024
Revised: 15-07-2024 Accepted: 10-11-2024
Published: 11-11-2024
Editor:
Dr.
William Castillo-González 
Corresponding Author: Viskasari
Pintoko Kalanjati *
ABSTRACT
Introduction: in
intrauterine growth restriction (IUGR), variation of head circumference (HC)
and impaired cognitive function have been reported.
Objective:
to analyze HC and cognitive scores of IUGR vs. normal growth fetus
(NGF).
Method: a systematic
review and meta-analysis were conducted based on the published articles in
PubMed, Scopus, Web of Sciences, and ProQuest (2003/1/1–2023/12/31) using
PRISMA guidelines and RevMan 5.4. The quality assessment of each article was
conducted using the Newcastle–Ottawa Quality Assessment Scale (NOS). The study
protocol was registered with the CRD42024547189 number in PROSPERO.
Results: the
final articles included are 4 (155 IUGR, 375 NGF). Pooled results from the
random-effects model showed that there was a significant difference in head
circumference in IUGR (n = 155) vs. NGF (n = 375) of term + preterm
[SMD= -0,42, 95 % CI= -0,62 to -0,21, P < 0,0001; I2 = 0 %, P =
0,79]; and IUGR (n = 128) vs. NGF (n = 326) of preterm newborns only
[SMD= - 0,44, 95 % CI= -0,67 to -0,21, P<0,0001; I2 = 0 %, P =
0,67]. The Bayley-III cognitive scales between IUGR (n = 94) vs. NGF (n
= 292) [SMD = - 0,30, 95 % CI = - 0,66 to 0,07, P = 0,11; I2 = 28 %,
P = 0,24].
Conclusions: although
there was a significant difference in the head circumference between IUGR and
NGF, there were no considerable differences in cognitive achievement. These
might be due to a successful effort during the catch-up period, when
malnutrition and other factors are addressed.
Keywords: Head
Circumference; Fetal Growth Restriction; Cognitive Impairment; Intellectual
Disability; Learning Disabilities.
RESUMEN
Introducción:
en el retraso del crecimiento intrauterino (RCIU) se han descrito variaciones
del perímetro cefálico (PC) y alteraciones de la función cognitiva.
Objetivo:
analizar la HC y las puntuaciones cognitivas de los fetos con RCIU frente a los
fetos con crecimiento normal (NGF).
Método:
se realizó una revisión sistemática y un metaanálisis basados en los artículos
publicados en PubMed, Scopus, Web of Sciences y ProQuest (2003/1/1-2023/12/31)
utilizando las directrices PRISMA y RevMan 5.4. La evaluación de la calidad de
cada artículo se realizó mediante la escala de evaluación de la calidad de
Newcastle-Ottawa (NOS). El protocolo del estudio se registró con el número
CRD42024547189 en PROSPERO.
Resultados:
los artículos finales incluidos son 4 (155 RCIU, 375 NGF). Los resultados
agrupados del modelo de efectos aleatorios mostraron que había una diferencia
significativa en el perímetro cefálico en RCIU (n = 155) frente a NGF (n = 375)
de término + pretérmino [DME= -0,42, IC 95 %= -0,62 a -0,21, P < 0,0001; I2
= 0 %, P = 0,79]; y RCIU (n = 128) frente a NGF (n = 326) de recién nacidos
prematuros solamente [DME= - 0,44, IC 95 %= -0,67 a -0,21, P<0,0001; I2 = 0
%, P = 0,67]. Las escalas cognitivas Bayley-III entre RCIU (n = 94) frente a
NGF (n = 292) [DME = - 0,30; IC del 95 % = - 0,66 a 0,07; P = 0,11; I2 = 28 %;
P = 0,24].
Conclusiones:
aunque existía una diferencia significativa en el perímetro cefálico entre RCIU
y NGF, no había diferencias considerables en el rendimiento cognitivo. Esto
podría deberse a un esfuerzo satisfactorio durante el período de recuperación,
cuando se abordan la malnutrición y otros factores.
Palabras clave:
Circunferencia Craneal; Restricción del Crecimiento Fetal; Deterioro Cognitivo;
Discapacidad Intelectual; Dificultades de Aprendizaje.
INTRODUCTION
Intrauterine growth
restriction (IUGR) is a condition in which neonates fail to reach the
appropriate growth potential due to genetic or environmental factors. It this
is characterized by birth weight below the 10th percentile for gestational age.(1,2,3)
IUGR refers to the condition when the fetus fails to achieve the potential
biological growth during pregnancy, adjusted to the age, sex, and race.(1,4,5)
The prevalence of IUGR
is approximately 24 % worldwide, which is about 30 million babies per year.(6)
IUGR is a significant cause of perinatal morbidity and mortality in about 5-10
% of pregnancies, with even higher rates reported in developing countries (21
%).(7)
Infants with IUGR have
been reported to face various neuropathological risks, including a higher
likelihood of learning difficulties and cognitive impairment. Studies by
Hartkopf J. et al. (2018) and Vollmer B. et al. (2019) found lower cognitive
scores in children with restricted fetal growth compared to those with normal
development, assessed using tools like the Bayley-III cognitive and Wechsler
Intelligence Scale.(10,11) However, some studies showed no
significant link between restricted growth and later cognitive achievement.(10,11,12)
In the symmetric form of growth restriction, head circumference was
significantly smaller than in normally grown infants, though the brain-sparing
phenomenon was observed in the asymmetric type.(13) An updated
report on head circumference and cognitive function in growth-restricted
infants is needed to highlight these parameters' importance in predicting
morbidity. To the best of our knowledge, limited reviews on both parameters
have been published recently.
We conducted a
systematic review/meta-analysis based on published articles since 2003 in four
major databases. This study aimed to analyze the difference in head
circumference and cognitive outcome in IUGR vs. NGF using PRISMA guidelines and
RevMan 5.4.(14,15)
METHOD
We present a systematic
review following the criteria of the Preferred Reporting Items for Systematic
Reviews and Meta-Analyses (PRISMA) statement.(16) The meta-analysis
was conducted to seek differences of the head circumferences and the cognitive
score between IUGR vs. NGF using Revman 5.4.(15) The study protocol
was registered with the CRD42024547189 number in the International Prospective
Register of Systematic Reviews (PROSPERO).
Eligibility
criteria
The inclusion criteria
include an original research report, case report, and clinical trials
investigating the head circumferences and cognitive outcomes among IUGR and NGF
infants published in the English language, in PubMed, Scopus, Web of Sciences,
and ProQuest (2003/1/1–2023/12/31). The exclusion criteria include reviews and
meta-analysis-type articles.
Research
strategies
A systematic review was
performed using combinations of the following keywords and terms: normal fetal
growth OR normal growth fetuses OR NGF OR appropriate for gestation OR AFG AND
intrauterine growth retardation OR intrauterine growth restriction OR IUGR OR
fetal growth retardation AND head circumference OR HC AND cognitive.
Data
synthesis
The data extraction was
processed using Mendeley Desktop software version 1.19.8, developed by Mendeley
Ltd in collaboration with Elsevier in Germany.(17) Duplicate entries
were eliminated, and two independent evaluators independently evaluated the
full text of these articles in the next stage.(18)
Quality
assessment and risk of bias in individual studies
The studies included
were assessed using the Newcastle–Ottawa QualityAssessment Scale (NOS), as
recommended by the Cochrane Collaboration.(19) This instrument has
three domains: selection, comparability, and outcomes. The selection domain
consists of four elements, with one element being comparability and three
elements being outcomes. The article can be rated with a maximum of four stars
based on each item, with selection receiving a maximum of four stars,
comparability receiving one or two stars, and results obtaining three stars. An
article was eliminated due to a significant risk of bias, which was determined
when some domains did not obtain a star.(19)
Statistical
analysis
The heterogeneity of
the studies was assessed using Cochran's Q-test and the I2 index.(20)
The Fisher z-transformation's findings were obtained using either a fixed
effect model (I2 < 50 %) or a random effect model (I2 > 50 %).(21)
In addition, statistical analysis was conducted using RevMan 5.4. The mean
differences were calculated and shown for continuous data, while risk ratios
were generated for dichotomous data. For continuous outcomes, when the unit of
measurement remained the same throughout all trials, the results were reported
as the weighted mean difference along with 95 % confidence intervals. A 95 %
confidence interval (CI) was employed to quantify the level of uncertainty
regarding the effects. The random-effects model was utilized for the
calculations, and the statistical approach employed was inverse variance.
Statistical significance was attributed to values of p < 0,05.(14)
For the descriptive
results, we computed weighted estimated averages in each article using random
effects (table 1). A t-test was conducted to verify the statistical disparities
between the two groups (IUGR vs. NGF or AGA-appropriate of gestational age)
based on head circumference (we conducted two types analysis: 1. From all 4
final included articles(22,23,24,25) regardless they were term or
preterm newborns; 2. Only from 3 included articles(22,24,25) i.e.
Morsing et al., Brembilla et al., Sacchi et al., which the newborns were all
preterm, both in IUGR and AGA groups). and cognitive results. The aim was to
identify statistically significant differences (p < 0,05) and ensure the
study's reliability.(14)
RESULTS
Study
selection
There were 792 articles
found in the initial database search. After eliminating duplicates, 349
articles met our inclusion criteria; 293 were disqualified based on a review of
their abstracts and titles, leaving 56 articles eligible for a full-text
analysis. For the qualitative and quantitative synthesis (meta-analysis), four
studies were chosen from the remaining articles due to the availability of
tested variables as indicated in the aim of this paper (i.e., IUGR is defined
as newborns with birthweight lower than 10th percentile; NGF is defined as
newborns with birthweight between 10th-90th percentile; cognitive outcome of
the infants were measured using either Bayley-III cognitive or Wechsler
Intelligence Scale Data on Children). The PRISMA flowchart was used to
illustrate the basis for exclusion following full-text reading as well as the
details of the approach. The PRISMA flowchart is
shown in figure 1.(14)
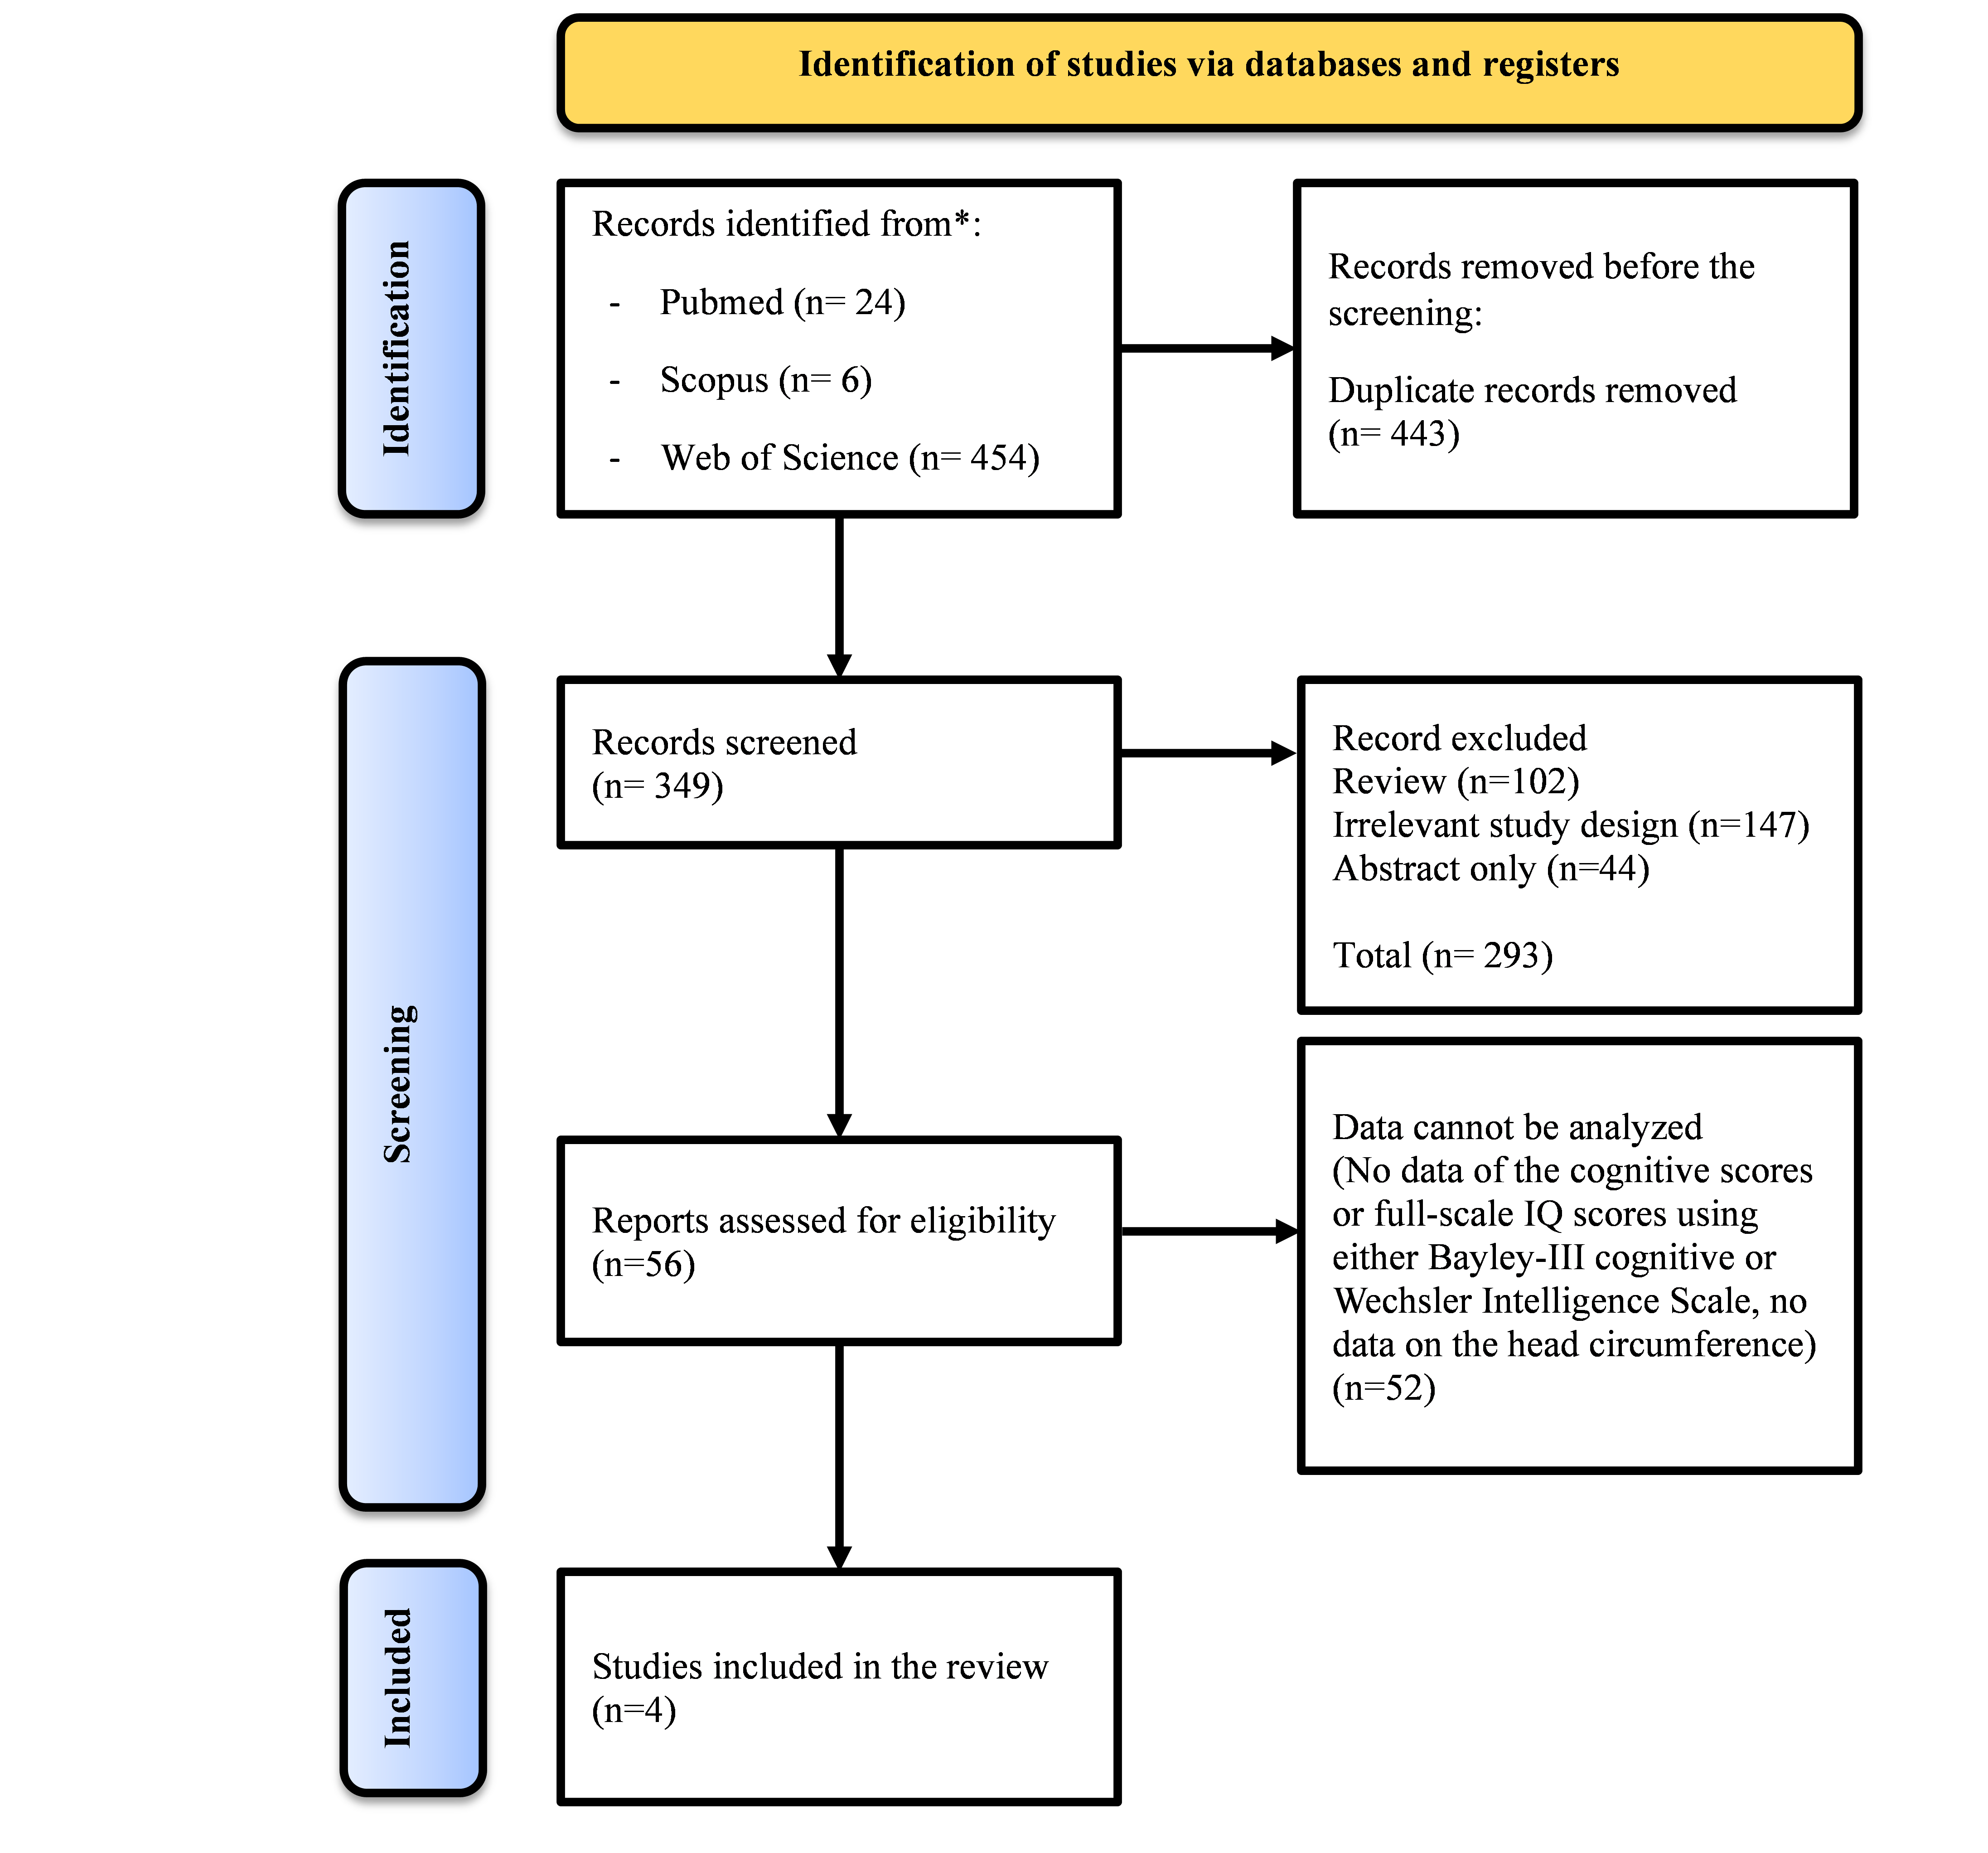
Figure 1.
PRISMA flowchart of this systematic review and meta-analysis
Study
characteristics
The four studies included
were published between 2003 and 2023, and all participants were children and
adolescents (0-18 years old).(22,23,24,25) The sample size averaged
132,5 participants (standard deviation [SD]: ± 121,04; range: 68–314). The mean
head circumference of IUGR participants was 34,7 cm (SD: ± 11,17; range:
25,8–50,6 cm). The mean head circumference of normal fetal growth participants
(control group) was 35,6 cm (SD: ± 11,08; range: 26,9–51,5 cm). Children and
adolescents between the ages of 22 and 216 months underwent cognitive
assessments. A total of two of the four articles included a control group
composed of children. Table 1 presents the
specific information on each study.(14)
|
Table 1.
Characteristics of the studies included in this systematic review
|
|
Author
|
Year of
publication
|
n
|
Head
circumference of IUGR (cm)
|
Head
circumference of NGF (cm)
|
Cognitive
outcomes
|
|
Morsing et al.(22)
|
2011
|
68
|
50,6
|
51,5
|
Full-scale
IQ scores
|
|
Jensen et al.(23)
|
2015
|
76
|
34,5
|
34,9
|
Full-scale
IQ scores
|
|
Brembilla
et al.(24)
|
2021
|
72
|
25,8
|
26,9
|
Cognitive
scores
|
|
Sacchi et al.(25)
|
2021
|
314
|
28,19
|
29,29
|
Cognitive
scores
|
|
Mean (± standard deviation)
|
|
|
34,7 (± 11,17)
|
35,6 (± 11,08)
|
|
|
p < 0,0001
|
Head
circumference and cognitive outcomes of IUGR and NGF
Of the included
articles, 3 (75 %) were observational studies,(22,23,24) and 1 (25
%) were a randomized controlled trial study.(25) All studies had a
control group. All studies evaluated head circumference and cognitive outcomes.(22,23,24,25)
The instruments used
were the Bayley-III cognitive scales in 2 (50 %) studies,(24,25)
Wechsler Intelligence Scale for Children-III/Wechsler Preschool and Primary
Scale of Intelligence-III in 1 (25 %) study,(22) and Wechsler Adult
Intelligence Scale in 1 (25 %) study.(23) An overview of the study's
predictors of head circumference and cognitive outcome is demonstrated in table
2.
Quality
and risk of bias assessment in studies
Our observational and
randomized controlled studies assessment was performed with the
Newcastle–Ottawa quality assessment scale (on the study and outcome level,
e.g., risk of bias).(19) The quality scores of the studies can be
found in table 2. The studies of Morsing et al. (2011), Jensen et al. (2015)
received eight points, and Brembilla et al. (2021) and Sacchi et al. (2021)
showed good quality with seven points. All of the four studies were
observational studies in three studies: Morsing et al. (2011), Jensen et al.
(2015), Brembilla et al. (2021), and randomized controlled in one study: Sacchi
et al. (2021). According to the NOS assessment, all four studies were
considered adequate for the meta-analysis (score >5 points).(19)
Assessment of head circumference
We conducted the RevMan 5.4 calculation of the
analysis based on the data. The results indicated that IUGR newborns had
significantly smaller head circumference size compared to the control group
with insignificant heterogeneity among the studies. When only the preterm
newborns were calculated, Standard Mean Difference IV, Random, 95 % CI (SMD= -
0,44, 95 % CI= -0,67 to -0,21) and heterogeneity from the analysis of head
circumference are P = 0,67, I2 = 0 % and the overall effect Z = 3,80
(P = 0,0001). The results indicated that preterm IUGR newborn had significantly
smaller head circumference size compared to the control group with
insignificant heterogeneity among the studies. The details of this analysis can
be seen in figure 2, 3 y 4.
|
Table 3. Forest
plot for the meta-analysis of head circumference from term and preterm IUGR vs.
NFG newborns
|
|
Study
|
IUGR
|
normal fetal
growth
|
Std. Mean
Difference
|
Weight
|
|
Mean
|
SD
|
Total
|
Mean
|
SD
|
Total
|
IV, Random,
95 % CI
|
|
|
Morsing et al.
|
50,6
|
2
|
34
|
51,5
|
1,7
|
34
|
-0,48
[-0,96, 0,00]
|
18,2 %
|
|
Jensen et al.
|
34,5
|
1,44
|
27
|
34,9
|
1,19
|
49
|
-0,31
[-0,78, 0,16]
|
18,9 %
|
|
Brembilla et al.
|
25,8
|
1,8
|
45
|
26,9
|
1,7
|
27
|
-0,62
[-1,11, -0,13]
|
17,7 %
|
|
Sacchi et al.
|
28,19
|
3
|
49
|
29,29
|
3,06
|
265
|
-0,36
[-0,67, -0,05]
|
45,1 %
|
|
Total (95 % CI)
|
|
|
155
|
|
|
375
|
-0,42
[-0,62, -0,21]
|
100,0 %
|
|
Heterogeneity: Tau2 = 0,00; Chi2
= 1,05, df = 3 (P = 0,79); I2 = 0 %
|
|
Test for overall effect: Z = 3,98 (P < 0,0001)
|
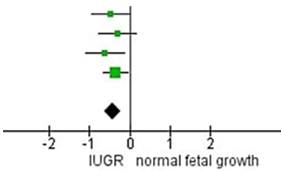
Figure 2. Forest
plot for the meta-analysis of head circumference from term and preterm IUGR vs.
NFG newborns
|
Table 4. Forest
plot for the meta-analysis of head circumference from only the preterm IUGR vs.
NFG newborns
|
|
Study
|
IUGR
|
normal fetal
growth
|
Std. Mean
Difference
|
Weight
|
|
Mean
|
SD
|
Total
|
Mean
|
SD
|
Total
|
IV, Random,
95 % CI
|
|
|
Morsing et al.
|
50,6
|
2
|
34
|
51,5
|
1,7
|
34
|
-0,48
[-0,96, 0,00]
|
22,4 %
|
|
Brembilla et al.
|
25,8
|
1,8
|
45
|
26,9
|
1,7
|
27
|
-0,62
[-1,11, -0,13]
|
21,9 %
|
|
Sacchi et al.
|
28,19
|
3
|
49
|
29,29
|
3,06
|
265
|
-0,36
[-0,67, -0,05]
|
55,7 %
|
|
Total (95 % CI)
|
|
|
128
|
|
|
326
|
-0,44
[-0,67, -0,21]
|
100,0 %
|
|
Heterogeneity: Tau2 = 0,00; Chi2
= 0,79, df = 2 (P = 0,67); I2 = 0 %
|
|
Test for overall effect: Z = 3,80 (P = 0,0001)
|
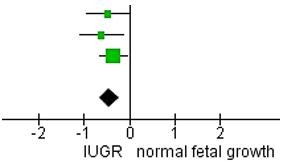
Figure 3. Forest
plot for the meta-analysis of head circumference from only the preterm IUGR vs.
NFG newborns
Assessment of cognitive outcomes
|
Table 5.
Forest plot for the meta-analysis of cognitive score based on Bayley-III
cognitive scale
|
|
Study
|
IUGR
|
normal fetal
growth
|
Std. Mean
Difference
|
Weight
|
|
Mean
|
SD
|
Total
|
Mean
|
SD
|
Total
|
IV, Random,
95 % CI
|
|
|
Brembilla et al.
|
106,1
|
8,6
|
33
|
106,3
|
13,9
|
17
|
-0,02
[-0,60, -0,57]
|
30,7 %
|
|
Sacchi et al.
|
88,78
|
10,88
|
45
|
94,25
|
13,31
|
239
|
-0,42
[-0,74, -0,10]
|
69,3 %
|
|
Total (95 % CI)
|
|
|
78
|
|
|
256
|
-0,30
[-0,66, -0,07]
|
100,0 %
|
|
Heterogeneity: Tau2 = 0,02; Chi2
= 1,40, df = 1 (P = 0,24); I2 = 28 %
|
|
Test for overall effect: Z = 1,60 (P = 0,11)
|
|
|
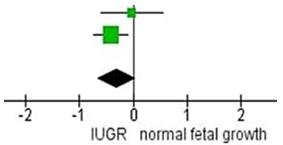
Figure 4.
Forest plot for the meta-analysis of cognitive score based on Bayley-III
cognitive scale
DISCUSSION
From these 4 included
articles, the head circumference in IUGR were significantly smaller compared to
NGF. On the other hand, the cognitive function in IUGR vs. NGF was lower
compared to NGF, although not statistically significant.(22,23,24,25)
IUGR can manifest as
symmetrical or asymmetrical in children born less than 10th percentile for its
gestational age. The circumstances arise during organogenesis in the first
until second trimester of pregnancy. About 20–25 % of all instances fall into
the first category (symmetrical IUGR). In this type, the IUGR is characterized
by a permanent loss in growth potential and a decrease in all fetal body
parameters, including internal organs and anthropometric dimensions.
Asymmetrical IUGR, on the other hand, accounts for 75–80 % of cases; their
weight is low, but their body length, head size, and chest circumference are
normal.(6) It has been shown in several studies that an abnormal
ratio between head circumference (HC) and abdominal circumference (AC) is a
better way to determine asymmetric vs. symmetrical IUGR. In cases of
symmetrical IUGR, the light-head circumference and length will all fall below
the 10th percentile. In cases of asymmetrical IUGR, however, only the height
will be below the 10th percentile, while the other measurements will align with
the gestational age.(1) If growth limitation occurs during the early
stages of pregnancy or there is no protective mechanism to support the fetal
growth, the restriction may be symmetrical. It could lead to asymmetric growth
restriction if it happens later, or is accompanied by adaptive processes.(13)
Several factors that
could influence the postnatal growth are nutrition, the parents' socioeconomic
standing, and the social environment in which they are raised. Infants with
symmetrical IUGR are underdeveloped postnatally and usually stay small
throughout their lives due to their reduced cell counts at birth. Individuals
with asymmetrical IUGR, on the other hand, have a better outlook and healthier
growth after birth because arguably they had normal cell counts at birth.(1)
Asymmetrical IUGR occurs when the fetus receives inadequate nutrition or oxygen
delivery, mostly in the third trimester of pregnancy, resulting in reduced body
size while maintaining normal or nearly normal brain size. Neonates with
symmetrical IUGR exhibit a decrease in the number of neurons in the hippocampus
and cerebrum. These reductions are possibly to be responsible for the cognitive
impairment reported in symmetrical IUGR cases. Nevertheless, the precise
processes responsible for cognitive impairments in symmetrical IUGR still
controversial.(26)
In the four included studies,
the IUGR might due to several factors i.e. ARED (Absent or Reversed End
Diastolic), preeclampsia, smoking in pregnancy, and previous birth of children
with small for gestational age; which correlated with impaired neurocognitive
outcomes.
The Bayley scales have
been a valuable instrument for identifying early developmental delays in
clinical and research settings for several decades. The Bayley scale is also
use eligibility for early detection and intervention programs for high-risk
newborns.(27,28) The Bayley Scales of Infant and Toddler
Development, the third edition (Bayley III), was released in 2006 and is widely
recognized as a reliable assessment instrument for measuring the development of
children aged 1 to 42 months.(29) Toddlers who were born very
preterm with intrauterine growth retardation or intrauterine growth restriction
(IUGR) had significantly lower cognitive scores on the Bayley-III compared to
those who were normal fetal growth (NGF)/appropriate for gestational age (AGA),
indicating that IUGR may lead to changes in cognitive development.(25)
The Wechsler
Intelligence Scale is a psychological instrument to assess an individual's
cognitive abilities and problem-solving aptitude. It may be likened to a
complete assortment of riddles and inquiries that assess an individual's
cognitive abilities in problem-solving, memory retention, and verbal and
numerical proficiency. This scale provides three primary scores: one for the
verbal intelligence quotient (the proficiency in using words), one for the
performance intelligence quotient (the ability to solve puzzles without relying
on words), and one total score that integrates these two.(11) The
study revealed that boys were born premature and with IUGR exhibited worse
cognitive outcomes in comparison to those with AGA.(22,23) The
examination comprises 15 subtests, out of which 10 are fundamental subtests
that contribute to four index scores: Verbal Comprehension (VC), Perceptual
Reasoning (PR), Working Memory (WM), and Processing Speed (PS). The Full-Scale
Intelligence Quotient (FSIQ) is a comprehensive assessment of general
intelligence determined based on several subtests' results.(31,32) FSIQ
is standardized using a mean of 100 and a standard deviation of 15,
guaranteeing its reliability and validity.(31) The WISC is commonly
employed by educational and clinical psychologists worldwide, with
modifications to accommodate various languages and cultures.(32)
CONCLUSIONS
In conclusion, we
observed that the head circumference in IUGR was significantly smaller than in
NGF (either in term and preterm, or in preterm only); however, the cognitive scales of both groups were
comparable. Although discretion must be taken when interpreting the
results of this analysis, our study provides more insight about the anatomy and
cognitive parameters in the IUGR compared to NGF children.
BIBLIOGRAPHIC REFERENCES
1. Sharma
D, Shastri S, Sharma P. Intrauterine Growth Restriction: Antenatal and
Postnatal Aspects. Clin Med Insights Pediatr. 2016;10:CMPed.S40070.
2. Gordijn
SJ, Beune IM, Thilaganathan B, Papageorghiou A, Baschat AA, Baker PN, et al.
Consensus definition of fetal growth restriction: a Delphi procedure.
Ultrasound Obstet Gynecol. 2016;48(3):333–9.
3.
Lees CC, Stampalija T, Baschat A, da Silva Costa F, Ferrazzi E, Figueras F, et
al. ISUOG Practice Guidelines: diagnosis and management of
small-for-gestational-age fetus and fetal growth restriction. Ultrasound Obstet
Gynecol. 2020;56(2):298–312.
4.
Hasmasanu MG, Bolboaca SD, Baizat MI, Drugan TC, Zaharie GC. Neonatal
short-term outcomes in infants with intrauterine growth restriction. Saudi Med
J. 2015;36(8):947–53.
5. Malhotra
A, Allison BJ, Castillo-Melendez M, Jenkin G, Polglase GR, Miller SL. Neonatal
morbidities of fetal growth restriction: Pathophysiology and impact. Front
Endocrinol (Lausanne). 2019;10(FEB):1–18.
6. Zamojska
J, Niewiadomska-Jarosik K, Kierzkowska B, Gruca M, Wosiak A, Smolewska E. Lipid
Profile in Children Born Small for Gestational Age. Nutrients. 2023;15(22).
7.
Shrivastava D, Master A. Fetal Growth Restriction. J Obstet Gynecol India
[Internet]. 2020;70(2):103–10. Available from: https://doi.org/10.1007/s13224-019-01278-4
8. Miller
SL, Huppi PS, Mallard C. The consequences of fetal growth restriction on brain
structure and neurodevelopmental outcome. J Physiol. 2016;594(4):807–23.
9.
Kalanjati VP, Wixey JA, Miller SM, Colditz PB, Bjorkman ST. GABAA receptor
expression and white matter disruption in intrauterine growth restricted
piglets. Int J Dev Neurosci [Internet]. 2017;59:1–9. Available from: http://dx.doi.org/10.1016/j.ijdevneu.2017.02.004
10.
Hartkopf J, Schleger F, Keune J, Wiechers C, Pauluschke-Froehlich J, Weiss M,
et al. Impact of intrauterine growth restriction on cognitive and motor
development at 2 years of age. Front Physiol. 2018;9(SEP):1–7.
11. Vollmer
B, Edmonds CJ. School age neurological and cognitive outcomes of fetal growth
retardation or small for gestational age birth weight. Front Endocrinol
(Lausanne). 2019;10(MAR).
12. Sacchi
C, De Carli P, Mento G, Farroni T, Visentin S, Simonelli A. Socio-emotional and
cognitive development in intrauterine growth restricted (IUGR) and typical
development infants: Early interactive patterns and underlying neural
correlates. Rationale and methods of the study. Front Behav Neurosci.
2018;12(December):1–11.
13. Guellec
I, Marret S, Baud O, Cambonie G, Lapillonne A, Roze JC, et al. Intrauterine
growth restriction, head size at birth, and outcome in very preterm infants. J
Pediatr [Internet]. 2015;167(5):975-981.e2. Available from: https://www.scopus.com/inward/record.uri?eid=2-s2.0-84945457054&doi=10.1016%2Fj.jpeds.2015.08.025&partnerID=40&md5=47c9af0a5cff905f2540de727f568b68
14.
Radaelli G, Leal-Conceição E, Neto FK, Taurisano MRG, Majolo F, Bruzzo FTK, et
al. Motor and cognitive outcomes of neonates with low birth weight in
Brazil: a systematic review and meta-analysis. Arq Neuropsiquiatr.
2023;81(2):186–200.
15. Hermena
S, Assaf A, Donaldson O. Systematic Review With Meta-Analysis: Are Muscle
Transfers a Satisfactory Treatment Option to Restore Shoulder Abduction in
Delayed Adult Brachial Plexus Injuries? Cureus. 2021;13(1):1–10.
16. Page
MJ, McKenzie JE, Bossuyt P, Boutron I, Hoffmann TC, Mulrow CD, et al. The
prisma 2020 statement: An updated guideline for reporting systematic reviews.
Med Flum. 2021;57(4):444–65.
17.
Endrinikapoulos A, Afifah DN, Mexitalia M, Andoyo R, Hatimah I, Nuryanto N.
Study of the importance of protein needs for catch-up growth in Indonesian stunted
children: a narrative review. SAGE Open Med. 2023;11.
18. Hendra
FN, Helder MN, Ruslin M, Van Cann EM, Forouzanfar T. A network meta-analysis
assessing the effectiveness of various radical and conservative surgical
approaches regarding recurrence in treating solid/multicystic ameloblastomas.
Sci Rep [Internet]. 2023;13(1):1–10. Available from: https://doi.org/10.1038/s41598-023-32190-7
19. Wells
G, Shea B, O’Connell D, Peterson J. The Newcastle-Ottawa Scale (NOS) for
assessing the quality of nonrandomised studies in meta-analyses. Ottawa, Ottawa
Hosp Res Inst [Internet]. 2000; Available from:
http://www.ohri.ca/programs/clinical_epidemiology/oxford.asp
20. Von
Hippel PT. The heterogeneity statistic I2 can be biased in small meta-analyses.
BMC Med Res Methodol. 2015;15(1):1–8.
21. Dettori
JR, Norvell DC, Chapman JR. Fixed-Effect vs Random-Effects Models for
Meta-Analysis: 3 Points to Consider. Glob Spine J. 2022;12(7):1624–6.
22. Morsing
E, Åsard M, Ley D, Stjernqvist K, Maršál K. Cognitive function after
intrauterine growth restriction and very preterm birth. Pediatrics.
2011;127(4).
23. Jensen
RB, Juul A, Larsen T, Mortensen EL, Greisen G. Cognitive ability in adolescents
born small for gestational age: Associations with fetal growth velocity, head circumference
and postnatal growth. Early Hum Dev [Internet]. 2015;91(12):755–60. Available
from: https://www.scopus.com/inward/record.uri?eid=2-s2.0-84983122754&doi=10.1016%2Fj.earlhumdev.2015.08.014&partnerID=40&md5=61e7352d9be5821c9a368b5fd4123885
24.
Brembilla G, Righini A, Scelsa B, Lista G, Balestriero M, Cesari E, et al. Neuroimaging and neurodevelopmental outcome after early fetal
growth restriction: NEUROPROJECT-FGR. Pediatr Res. 2021 Oct;90(4):869–75.
25. Sacchi
C, O’Muircheartaigh J, Batalle D, Counsell SJ, Simonelli A, Cesano M, et al.
Neurodevelopmental Outcomes following Intrauterine Growth Restriction and Very
Preterm Birth. J Pediatr [Internet]. 2021;238:135-144.e10. Available from:
https://doi.org/10.1016/j.jpeds.2021.07.002
26. Naganos
S, Ueno K, Horiuchi J, Saitoe M. Learning defects in Drosophila growth
restricted chico mutants are caused by attenuated adenylyl cyclase activity.
Mol Brain [Internet]. 2016;9(1):1–10. Available from:
http://dx.doi.org/10.1186/s13041-016-0217-3
27.
Anderson PJ, Burnett A. Assessing developmental delay in early childhood —
concerns with the Bayley-III scales. Clin Neuropsychol [Internet].
2017;31(2):371–81. Available from:
http://dx.doi.org/10.1080/13854046.2016.1216518
28.
Torras-Mañá M, Guillamón-Valenzuela M, Ramírez-Mallafré A, Brun-Gasca C,
Fornieles-Deu A. Usefulness of the Bayley scales of infant and toddler
development, third edition, in the early diagnosis of language disorder.
Psicothema. 2014;26(3):349–56.
29. Ballot
DE, Ramdin T, Rakotsoane D, Agaba F, Davies VA, Chirwa T, et al. Use of the
Bayley Scales of Infant and Toddler Development, Third Edition, to Assess
Developmental Outcome in Infants and Young Children in an Urban Setting in
South Africa. Int Sch Res Not. 2017;2017:1–5.
30. Watkins
MW, Canivez GL, Dombrowski SC, McGill RJ, Pritchard AE, Holingue CB, et al.
Long-term stability of Wechsler Intelligence Scale for Children–fifth edition
scores in a clinical sample. Appl Neuropsychol Child. 2022;11(3):422–8.
31. Gomez
R, Vance A, Watson SD. Structure of the Wechsler intelligence scale for
children - Fourth edition in a group of children with ADHD. Front Psychol.
2016;7(MAY):1–11.
32. Canivez
GL, Watkins MW, Good R, James K, James T. Construct validity of the Wechsler
Intelligence Scale for Children – Fourth UK Edition with a referred Irish
sample: Wechsler and Cattell–Horn–Carroll model comparisons with 15 subtests.
Br J Educ Psychol. 2017;87(3):383–407.
33.
Abdelhamid GSM, Bassiouni MGA, Gómez-Benito J. Assessing cognitive abilities
using the wais-iv: An item response theory approach. Int J Environ Res Public
Health. 2021;18(13).
34.
Cicinelli G, Nobile E, Brighenti S, Bari S, Tonella E, Aresi A, et al. Wechsler
Intelligence Scale for Adults - Fourth Edition profiles of adults with autism
spectrum disorder. Epidemiol Psychiatr Sci. 2022;31.
35. Merz
ZC, Van Patten R, Hurless N, Grant A, McGrath AB. Furthering the Understanding
of Wechsler Adult Intelligence Scale-Fourth Edition Factor Structure in a Clinical
Sample. Appl Neuropsychol [Internet]. 2021;28(1):12–23. Available from: https://doi.org/10.1080/23279095.2019.1585351
FINANCING
No financing.
CONFLICT OF INTEREST
The authors have no conflict
of interest to declare.
AUTHORSHIP CONTRIBUTION
Conceptualization: Galih
Indra Permana, Viskasari Pintoko Kalanjati.
Data curation: Galih
Indra Permana, Viskasari Pintoko Kalanjati.
Formal analysis: Galih
Indra Permana, Viskasari Pintoko Kalanjati.
Methodology: Galih
Indra Permana, Viskasari Pintoko Kalanjati.
Project
management: Galih Indra Permana, Viskasari Pintoko
Kalanjati, Rimbun rimbun, Abdurachman abdurachman.
Supervision: Galih
Indra Permana, Viskasari Pintoko Kalanjati, Rimbun rimbun, Abdurachman
abdurachman.
Validation: Galih
Indra Permana, Viskasari Pintoko Kalanjati, Rimbun rimbun, Abdurachman
abdurachman.
Display: Galih
Indra Permana, Viskasari Pintoko Kalanjati.
Drafting
– original draf: Galih Indra Permana, Viskasari
Pintoko Kalanjati.